...
| Fig 1 | Locations of PingER Monitoring and Remote sites | http://www-iepm.slac.stanford.edu/pinger/pingerworld/ |
| Table 1 | PingER Monitored Countries and populations | http://www-iepm.slac.stanford.edu/pinger/sites-per-country.html gives the number of countries monitored in a region. |
| Fig 3 | Number of sites monitored by SLAC | Use http://www-wanmon.slac.stanford.edu/cgi-wrap/pingtable.pl, see the # pairs in the Summary at the end. This time of year is a good time to ensure we have at least 2 working sites per country. To find sites use HostSearcher.pl. To update the meta database use NODEDETAILS. |
| Fig 4 | Packet loss by region by year | Look in /afs/slac/g/www/www-iepm/pinger/prmout/packet_loss-EDU.SLAC.STANFORD.N3-continent-allyearly.csv. You can also look in http://www-iepm.slac.stanford.edu/pinger/prmout/. The file is usually updated by prm.pl via trscrontab (see http://www-iepm.slac.stanford.edu/pinger/crontab-slaconly.txt) at the start of the year to get the previous year. You should run the script again (Note: You need to run it from pinger@pinger)time /afs/slac.stanford.edu/package/pinger/prm/prm.pl -lp true -c /afs/slac.stanford.edu/package/pinger/prm/prm-allyearly-continent.conffOnce you have the csv file (see above) check the date with 155cottrell@pinger:~$ls -l /afs/slac/g/www/www-iepm/pinger/prmout/*-EDU.SLAC.STANFORD.N3-continent-allyearly.csv then you can use Excel to produce the chart. |
| Fig 5 | Minimum RTTs measured from SLAC | Go to http://www-iepm.slac.stanford.edu/pinger/explorer.html, click on Motion Histogram. You will need to update the data to bring it up to date. See PingER Data Explorer document. |
| Fig 7 | Minimum RTT from SLAC to various Countries | See Fig 5 above and click on Line Chart instead of Motion Histogram. |
| Fig 8 | Jitter from SLAC | See Fig 4, just use the csv file /afs/slac/g/www/www-iepm/pinger/prmout/ipdv-EDU.SLAC.STANFORD.N3-continent-allyearly.csv as input to Excel |
| Fig 9 | Yearly averaged normalize derived TCP throughputs from SLAC | See Fig 4, just use the csv file /afs/slac/g/www/www-iepm/pinger/prmout/nthroughput-EDU.SLAC.STANFORD.N3-continent-allyearly.csv as input to Excel |
| Figs 10 & 11 | Derived throughputs from SLAC | See Fig 4, just use the csv file /afs/slac/g/www/www-iepm/pinger/prmout/throughput-EDU.SLAC.STANFORD.N3-continent-allyearly.csv as input to Excel |
| Fig 12 | Normalized throughputs to regions seen from CERN | Look in /afs/slac/g/www/www-iepm/pinger/prmout/nthroughput-CH.CERN.N20-continent-allyearly.csv. It is usually updated by prm.pl via trscrontab (see http://www-iepm.slac.stanford.edu/pinger/crontab-slaconly.txt) at the start of the year to get the previous year. You should run the script again /afs/slac.stanford.edu/package/pinger/prm/prm.pl -lp true \ -c /afs/slac.stanford.edu/package/pinger/prm/prm-allyearly-continent-cern.conf Once you have the csv file (see above) you can use Excel to produce the chart. |
| Table 3 | Derived throughputs in kbit/s | Go to http://www-wanmon.slac.stanford.edu/cgi-wrap/table.pl. Select From TLD, To Continent, TCP Throughput (kbits/s) and the previous month. Click on submit. Wait (be patient takes a couple of minutes). Cut and paste the resultant table into Excel and then use Excel to re-arrange and re-format. |
| Fig 14 | Throughput from SLAC to SE Asian countries | Go to http://www-iepm.slac.stanford.edu/pinger/prmout/throughput-EDU.SLAC.STANFORD.N3-country-allyearly.csv download into Excel and extract Singapore, Malaysia, Vietnam,Indonesia, Brunei, Cambodia, Laos. |
| New Fig | Throughput from Malaysia to S.E. Asian countries | Go to http://www-iepm.slac.stanford.edu/pinger/prmout/throughput-Malaysia-country-allyearly.csv download into Excel and extract Singapore, Malaysia, Vietnam,Indonesia, Brunei, Cambodia, Laos. |
Moving data between Linux and Windows
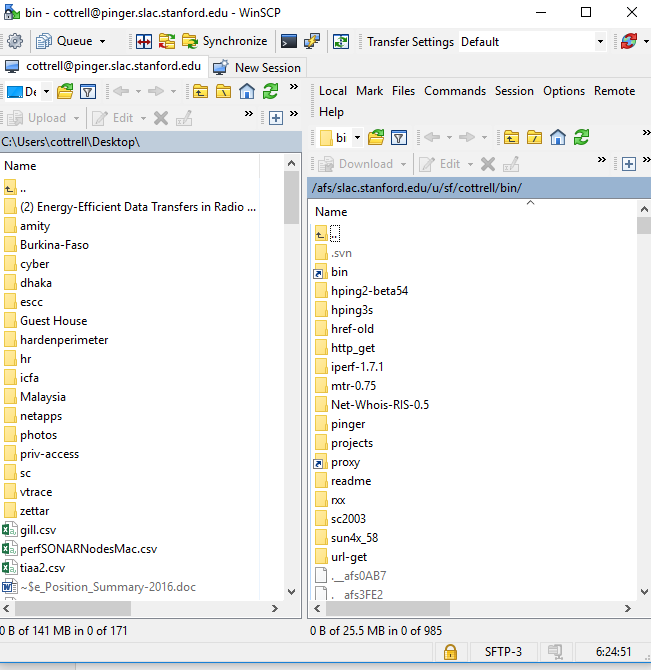
We use the WinSCP app