Page History
Contents
| Table of Contents |
|---|
| Anchor | ||||
|---|---|---|---|---|
|
Online Monitoring GUI
| Anchor | ||||
|---|---|---|---|---|
|
...
Using the Online Monitoring GUI
...
"Restart DAQ" icon on operator console brigns up multiple GUI panels for DAQ system. Online Monitoring GUI is as shown below:
? 
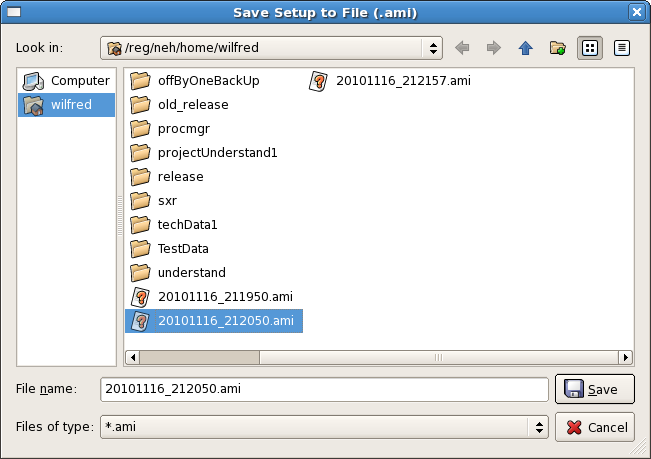
Setup : This section deals with setting up various display windows for online monitoring. "Save" control provides a way to archive configuration of current display windows. (X-Y plots, 2-D frame etc.) Whereas, "Load" control retrives existing display windows configuration. Display configuration is saved in file with extension ".ami" as shown in following figure.
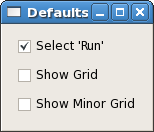
"Defaults" control provides users a feature to set specific settings (show grid/minor grid etc.) of online monitoring plots as default.
Data: This section provides various features for data in various plots. "Reset Plots" control will reset the all displayed plots by clearing their content and restart ploting with new set of data. Users can save plots using "Save Plots" control available in this section. Plot data will be saved as ".dat" file in terms of values associated with its axis.
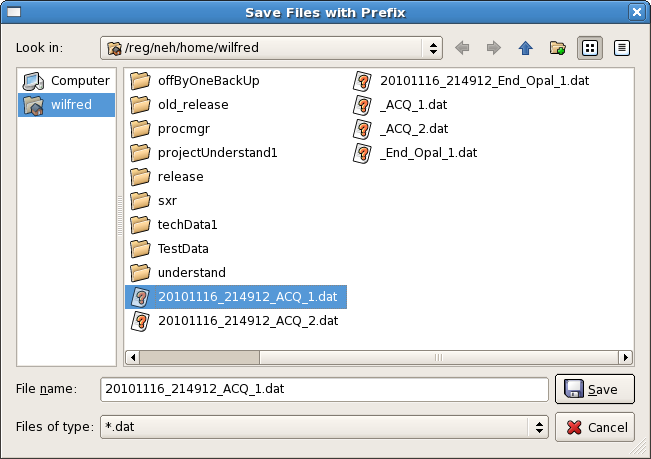
For X-Y plot (Acqiris Digitizer Waveform), contents of saved plot will be saved as value vectors of X and Y axis in a ".dat" file as shown below:
| No Format |
|---|
| Wiki Markup |
*Contents* {toc} {anchor:Online Monitoring GUI} h4. Online Monitoring GUI {anchor:Using the Online Monitoring GUI} h6. Using the Online Monitoring GUI "Restart DAQ" icon on operator console brigns up multiple GUI panels for DAQ system. Online Monitoring GUI is as shown below: ? !Annotated Online Monitoring 2.png! *Setup* : This section deals with setting up various display windows for online monitoring. "Save" control provides a way to archive configuration of current display windows. (X-Y plots, 2-D frame etc.) Whereas, "Load" control retrives existing display windows configuration. Display configuration is saved in file with extension ".ami" as shown in following figure. !Screenshot-Save Setup to File (.ami).png! "*Defaults*" control provides users a feature to set specific settings (show grid/minor grid etc.) of online monitoring plots as default. !Screenshot-Defaults.png!\\ *Data*: This section provides various features for data in various plots. "Reset Plots" control will reset the all displayed plots by clearing their content and restart ploting with new set of data. Users can save plots using "Save Plots" control available in this section. Plot data will be saved as ".dat" file in terms of values associated with its axis. !Screenshot-Save Files with Prefix-1.png! For X-Y plot (Acqiris Digitizer Waveform), contents of saved plot will be saved as value vectors of X and Y axis in a ".dat" file as shown below: {noformat} 1.5e-09 0.000561523 2.5e-09 0.000170898 3.5e-09 0.000170898 4.5e-09 0.000366211 5.5e-09 -0.000195313 6.5e-09 0.000268555 7.5e-09 7.32422e-05 8.5e-09 0.000366211 9.5e-09 7.32422e-05 1.05e-08 7.32422e-05 : : {noformat} |
List
...
of
...
primary
...
event
...
displays
...
is
...
shown
...
at
...
the
...
bottom
...
part
...
of
...
the
...
"Online
...
Monitoring
...
Window".
...
This
...
list
...
reflects
...
various
...
detectors
...
involved
...
in
...
current
...
run
...
of
...
experiment.
...
A
...
mouse
...
click
...
on
...
specic
...
event
...
display
...
will
...
openup
...
corresponding
...
data
...
monitoring
...
plot.
...
Each
...
type
...
of
...
data
...
plots
...
has
...
multiple
...
features
...
attched
...
to
...
it
...
which
...
will
...
be
...
covered
...
in
...
following
...
section.
...
?? 
Details of Scalar variables/data
? 
Ebeam and Ipimb data view details
?
? 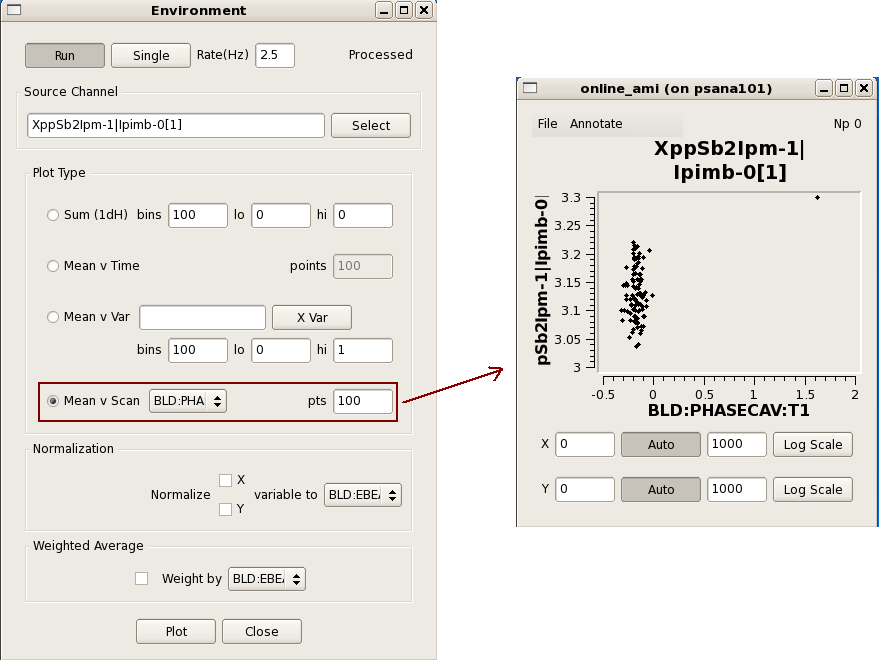
Correlation plots between 2 scalar data object
? 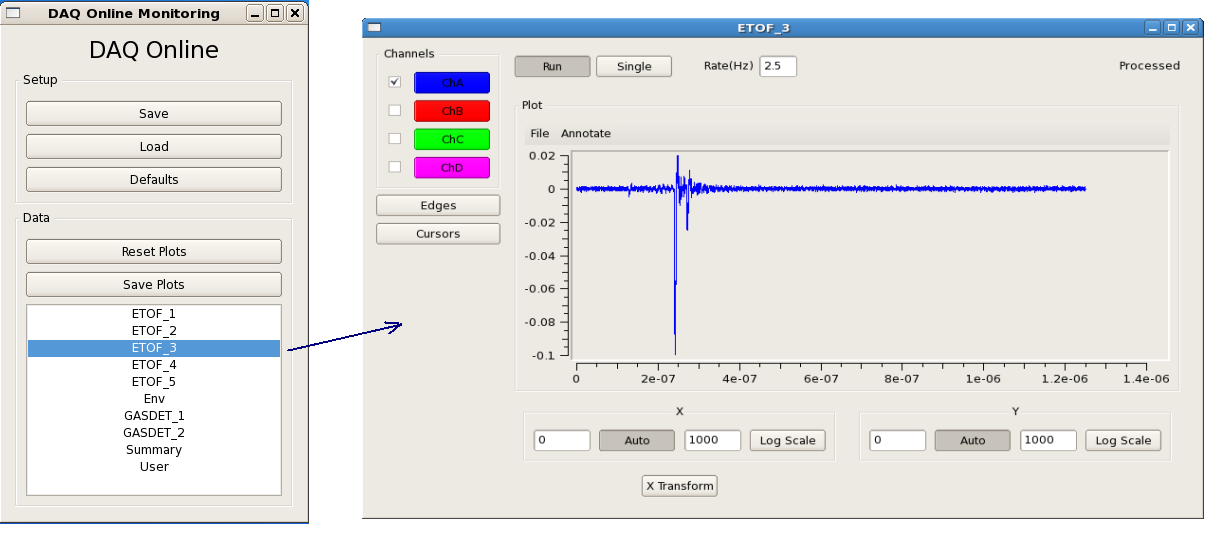
Waveform Display
? 
Acqiris Details
? 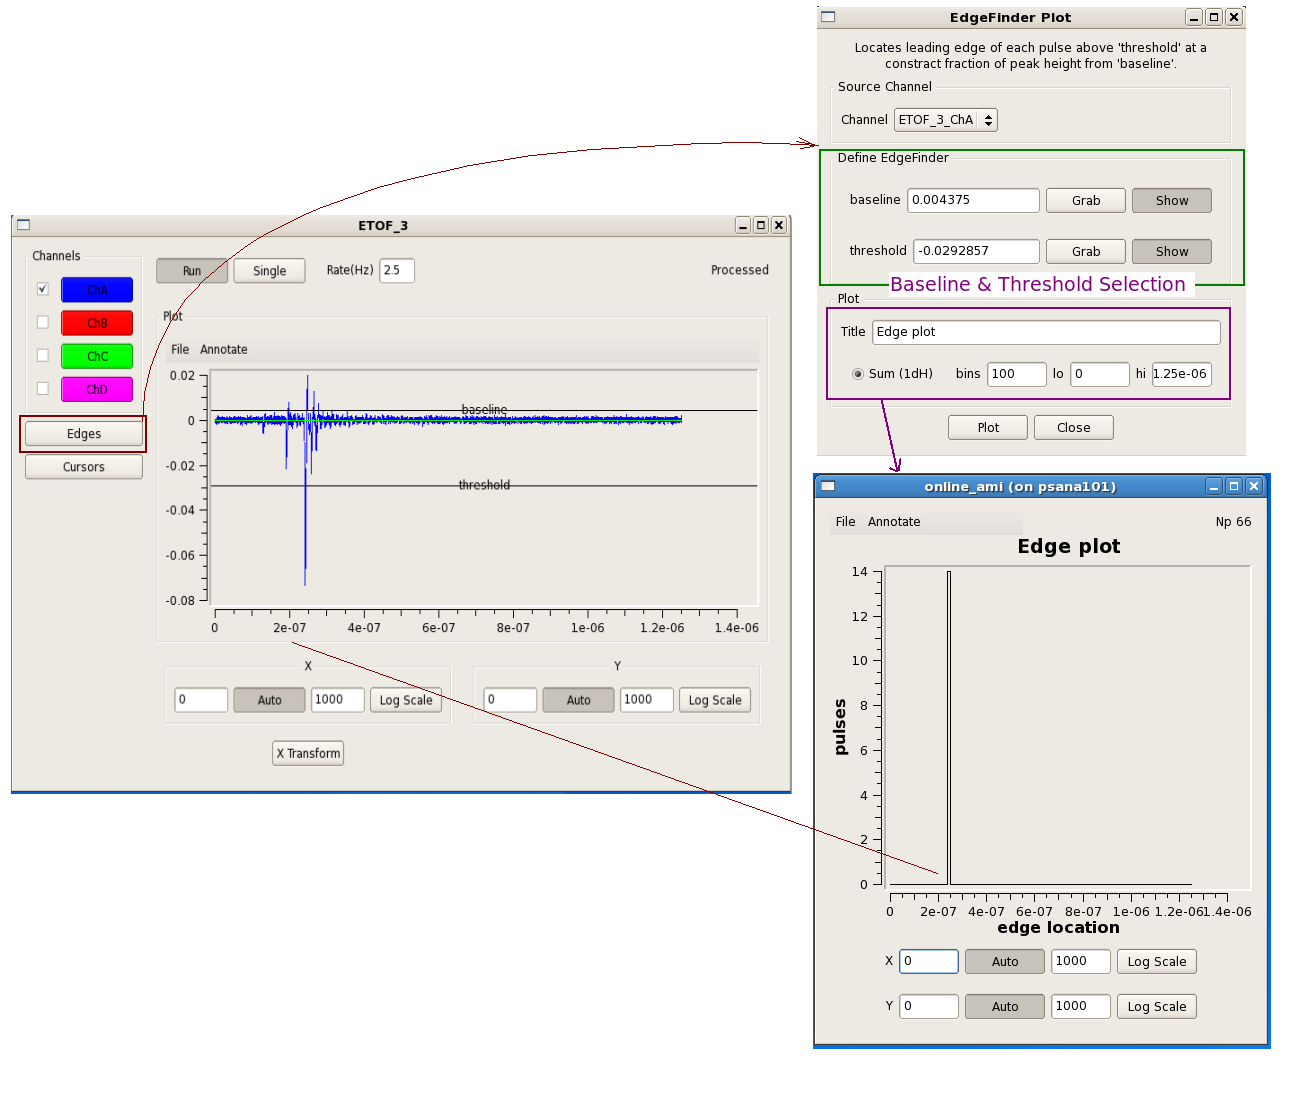
Edge operations
? 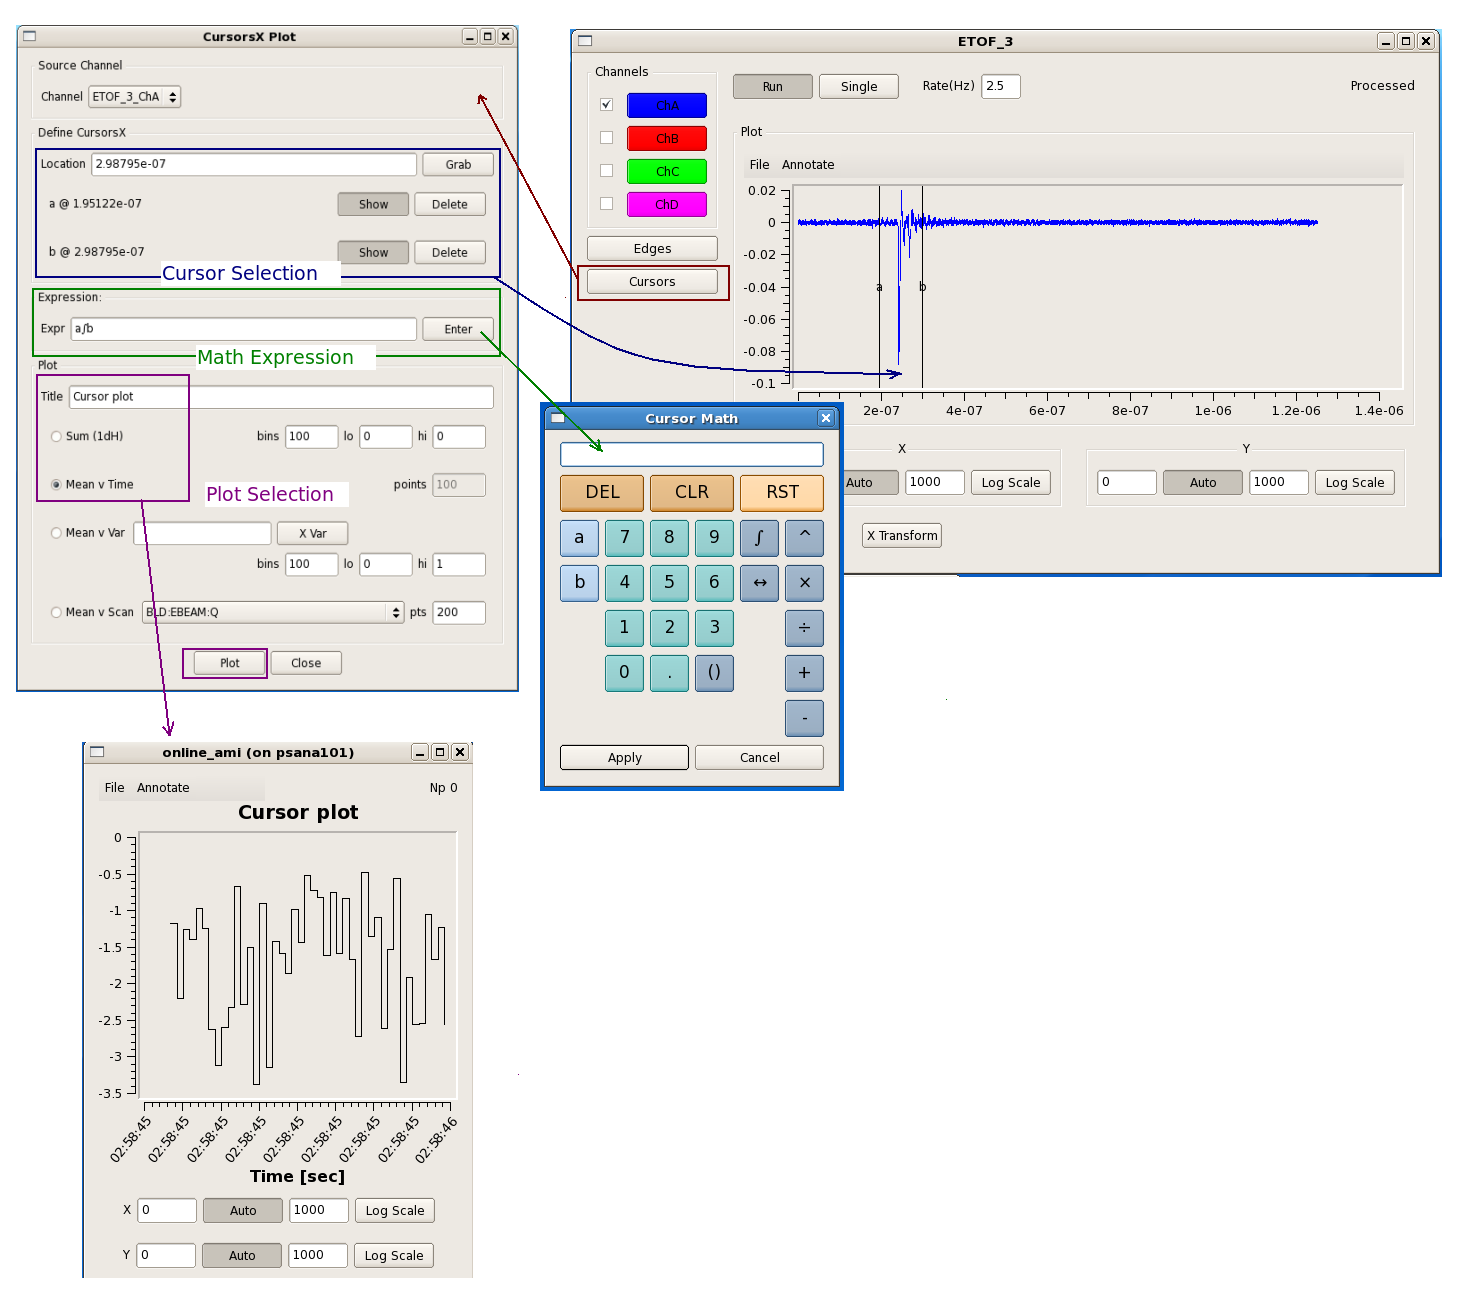
Cursors Operations
Features attched to it which will be covered in following section.
| Anchor | ||||
|---|---|---|---|---|
|
...
Writing a plug-in to the Online Monitoring GUI
...
The core online monitoring can be specialized by supplying plug-in modules containing user code. Two types of modules can be added - either analysis modules for generating additional plots or filter modules for selecting a subset of events to be used by the monitoring. The steps are:
- Copy /reg/g/pcds/package/amiuser
...
- to
...
- your
...
- area
...
Code Block
...
cp -rf /reg/g/pcds/package/amiuser ~/.
...
- Edit the ExampleAnalysis.
...
- {hh,cc
...
- }
...
- files
...
- or
...
- ExampleFilter.
...
- {hh,cc
...
- }
...
- files
...
Code Block
...
cd ~/amiuser; gedit ExampleAnalysis.cc
...
- Build the libamiuser.so
...
- and
...
- libamiuser_filter.so
...
- libraries
...
Code Block
...
make all
...
- Copy the libamiuser.so
...
- and
...
- libamiuser_filter.so
...
- to
...
- your
...
- experiment's
...
- home
...
- area
...
Code Block
...
 cp libamiuser.so ~amoopr/.
 cp libamiuser_filter.so ~amoopr/.
...
\\\\
...
The
...
"~amoopr/libamiuser.so"
...
plug-in
...
module
...
is
...
specified
...
explicitly
...
in
...
the
...
"-L"
...
command-line
...
option
...
for
...
the
...
monitoring
...
executable
...
that
...
appears
...
in
...
/reg/g/pcds/dist/pds/amo/scripts/amo.cnf,
...
for
...
example.
...
It
...
is
...
possible
...
to
...
specify
...
a
...
comma
...
separated
...
list
...
of
...
libraries
...
in
...
the
...
"-L"
...
option
...
to
...
include
...
more
...
than
...
one
...
plug-in
...
module.
...
Similarly,
...
the
...
"~amoopr/libamiuser_filter.so"
...
plug-in
...
module
...
is
...
specified
...
in
...
the
...
"-F"
...
command-line
...
option.
...
The
...
plug-in
...
modules
...
will
...
be
...
picked
...
up
...
the
...
next
...
time
...
the
...
DAQ
...
system
...
is
...
restarted.
...
The
...
new
...
plots
...
will
...
appear
...
in
...
the
...
"User"
...
selection.
...

These instructions also appear in the amiuser/README
...
file.
...
The
...
ExampleAnalysis
...
class
...
contains
...
several
...
member
...
functions
...
that
...
must
...
be
...
implemented:
...
- clear()
...
- -
...
- unregister
...
- plots
...
- and
...
- disable
...
- analysis
...
- create()
...
- -
...
- register
...
- plots
...
- and
...
- enable
...
- analysis
...
- reset()
...
- -
...
- called
...
- prior
...
- to
...
- a
...
- new
...
- configuration
...
- clock(timestamp)
...
- -
...
- called
...
- once
...
- for
...
- each
...
- event
...
- or
...
- configuration
...
- configure(detectorid,
...
- datatype,
...
- data*)
...
- -
...
- called
...
- for
...
- each
...
- detector
...
- datum
...
- in
...
- the
...
- configuration
...
- event(detectorid,
...
- datatype,
...
- data*)
...
- -
...
- called
...
- for
...
- each
...
- detector
...
- datum
...
- in
...
- the
...
- event
...
- analyze()
...
- -
...
- called
...
- once
...
- after
...
- all
...
- 'event()'
...
- callbacks
...
- have
...
- completed
...
The
...
'detectorid'
...
arguments
...
are
...
of
...
the
...
form
...
Pds::Src
...
and
...
may
...
be
...
cast
...
for
...
comparison
...
against
...
detector
...
identities
...
such
...
as
...
Pds::DetInfo
...
or
...
BLD
...
identities
...
such
...
as
...
Pds::BldInfo
...
(Pds::
...
classes
...
from
...
pdsdata/xtc
...
package).
...
The
...
'datatype'
...
arguments
...
are
...
of
...
the
...
form
...
Pds::TypeId
...
which
...
is
...
a
...
class
...
denoting
...
the
...
data
...
format
...
(image,
...
waveform,
...
etc.,
...
and
...
version,
...
also
...
from
...
pdsdata/xtc
...
package).
...
The
...
'data*'
...
arguments
...
are
...
pointers
...
to
...
the
...
configuration
...
or
...
event
...
data
...
(from
...
pdsdata/<type>
...
package).
...
For
...
the
...
'configure'
...
callbacks
...
with
...
relevant
...
data,
...
the
...
data
...
should
...
be
...
copied.
...
For
...
the
...
'event'
...
callbacks,
...
the
...
pointers
...
may
...
simply
...
be
...
copied
...
and
...
referenced
...
when
...
the
...
'analyze'
...
function
...
is
...
called.
...
Six
...
types
...
of
...
plots
...
may
...
be
...
displayed
...
{
...
Strip
...
chart,
...
1D
...
histogram,
...
1D
...
profile
...
histogram,
...
waveform,
...
2D
...
image,
...
2D
...
scatter
...
plot
...
}
...
by
...
instanciating
...
the
...
ami/data
...
classes
...
{
...
EntryScalar,
...
EntryTH1F,
...
EntryProf,
...
EntryWaveform,
...
EntryImage,
...
EntryScan
...
},
...
respectively.
...
The
...
interfaces
...
for
...
these
...
classes
...
are
...
found
...
in
...
the
...
corresponding
...
release/ami/data/Entry*.hh
...
files.
...
For
...
example,
...
a
...
1D
...
histogram
...
is
...
created
...
by
...
generating
...
its
...
description
| Code Block |
|---|
} DescTH1F(const char* name, const char* xtitle, const char* ytitle, unsigned nbins, float xlow, float xhigh) {code} |
as
...
found
...
in
...
release/ami/data/DescTH1F.hh
...
and
...
passing
...
it
...
to
...
the
...
EntryTH1F
...
constructor.
...
For
...
example,
| Code Block |
|---|
} DescTH1F desc("My Plot","My X title","My Y title",100, 0., 1.); EntryTH1F* plot = new EntryTH1F( desc ); {code} |
The
...
plot
...
may
...
be
...
filled
...
by
...
calling
...
its
...
function
| Code Block |
|---|
} plot->addcontent(weight, x_value); {code} |
and
...
validated
...
for
...
display
...
by
...
calling
| Code Block |
|---|
} plot->valid(); {code} |
See
...
the
...
examples
...
{ExampleAnalysis.cc,
...
AcqirisAnalysis.cc,
...
CamAnalysis.cc
...
}.
...
The
...
new
...
plots
...
will
...
appear
...
in
...
the
...
'User'
...
section
...
of
...
the
...
online
...
monitoring
...
with
...
a
...
separate
...
tab
...
for
...
each
...
added
...
plot.
...
Multiple
...
plots
...
may
...
appear
...
in
...
the
...
same
...
tab
...
if
...
their
...
titles
...
end
...
in
...
the
...
same
...
string
...
-
...
'#'
...
followed
...
by
...
a
...
page
...
title;
...
for
...
example,
...
two
...
plots
...
titled
...
'First
...
energy
...
plot#Energy'
...
and
...
'Second
...
energy
...
plot#Energy'
...
will
...
appear
...
on
...
a
...
page
...
titled
...
'Energy'
...
with
...
the
...
individual
...
titles
...
'First
...
energy
...
plot'
...
and
...
'Second
...
energy
...
plot'.
...
This
...
should
...
allow
...
users
...
to
...
add
...
a
...
few
...
additional
...
plots
...
using
...
operations
...
not
...
supported
...
by
...
the
...
generic
...
monitoring.
...
The
...
ExampleFilter
...
class
...
contains
...
several
...
member
...
functions
...
that
...
must
...
be
...
implemented:
...
- name()
...
- -
...
- return
...
- a
...
- string
...
- name
...
- for
...
- the
...
- module
...
- clock(timestamp)
...
- -
...
- called
...
- once
...
- for
...
- each
...
- event
...
- or
...
- configuration
...
- configure(detectorid,
...
- datatype,
...
- data*)
...
- -
...
- called
...
- for
...
- each
...
- detector
...
- datum
...
- in
...
- the
...
- configuration
...
- event(detectorid,
...
- datatype,
...
- data*)
...
- -
...
- called
...
- for
...
- each
...
- detector
...
- datum
...
- in
...
- the
...
- event
...
- accept()
...
- -
...
- return
...
- a
...
- filter
...
- decision
...
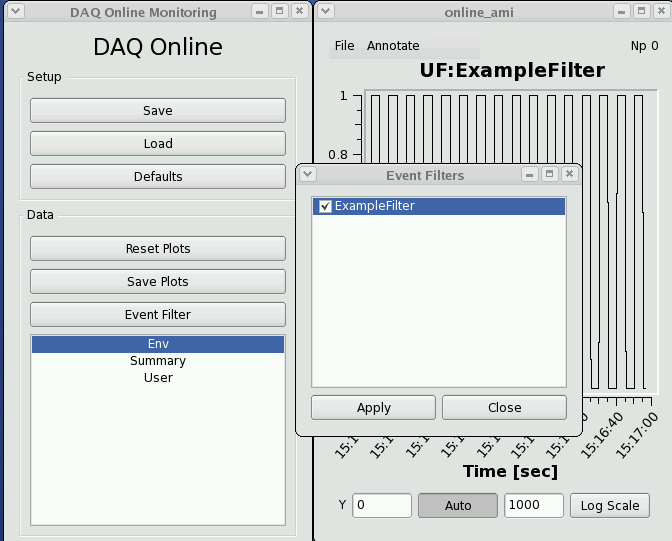
The
...
filter
...
module
...
names
...
will
...
appear
...
in
...
the
...
'Event
...
Filters'
...
section
...
of
...
the
...
online
...
monitoring
...
for
...
selection
...
as
...
global
...
filters,
...
and
...
the
...
names
...
will
...
also
...
appear
...
in
...
the
...
'Env'
...
section
...
of
...
the
...
monitoring
...
for
...
use
...
as
...
filters
...
on
...
individual
...
plots.
...
This
...
should
...
allow
...
users
...
to
...
improve
...
the
...
generic
...
monitoring
...
for
...
infrequent
...
or
...
specially
...
classified
...
events.
...
It
...
is
...
also
...
a
...
testbed
...
for
...
how
...
users
...
may
...
be
...
able
...
to
...
reduce
...
recorded
...
data
...
volumes,
...
if
...
so
...
desired.
| Anchor | ||||
|---|---|---|---|---|
|
...
Writing a user application (reads from shared memory)
...
| Anchor | ||||
|---|---|---|---|---|
|
...
Online Monitoring and Simulation Using Files
...
The online monitoring system will interface the DAQ system to the
monitoring software through a shared memory interface. The two sides
communicate with each other via POSIX message queues. The DAQ system
will fill the shared memory buffers with events which are also known
as transitions. The DAQ system notifies the monitoring software that
each buffer is ready by placing a message in the monitor output queue
containing the index of the newly available event buffer.
When the monitoring software is finished with a shared memory buffer
it releases the buffer by returning the message via its output queue.
The DAQ monitoring system does not store events. If no shared memory
buffers are available, then any events that go past the monitoring
station during that time will not be monitored.
To facilitate the development and testing of monitoring software, SLAC
has developed a file server that mimics the DAQ system. Instead of
live data from the DAQ system, it reads a file and presents it to the
monitoring software via the shared memory interface the same way that
the DAQ system does. One difference is that the file server will not
drop events if the monitoring software takes too long. It will wait
indefinitely for a free buffer for the next event in the file.
To use the example files you will need two shells. The executables are in
release/build/pdsdata/bin/i386-linux-dbg.
...
Assuming
...
both
...
shells
...
are
...
in
...
the
...
executable
...
directory,
...
first
...
start
...
the
...
server
...
with
...
something
...
like:
| Code Block |
|---|
} ./xtcmonserver -f ../../../../opal1k.xtc -n 4 -s 0x700000 -r 120 -p yourname -c 1 [-l] {code} |
This
...
points
...
the
...
software
...
at
...
the
...
xtc
...
example
...
file,
...
specifying
...
four
...
message
...
buffers
...
and
...
the
...
size
...
of
...
each
...
message
...
buffer.
...
The
...
-r
...
option
...
specifies
...
the
...
rate
...
that
...
events
...
will
...
be
...
sent
...
in
...
cps,
...
limited
...
only
...
by
...
the
...
I/O
...
and
...
CPU
...
speeds
...
of
...
the
...
platform
...
you
...
are
...
running
...
on.
...
The
...
last
...
parameter
...
shown
...
is
...
a
...
"partition
...
tag"
...
string
...
that
...
is
...
added
...
the
...
name
...
of
...
the
...
message
...
queue,
...
to
...
allow
...
multiple
...
people
...
to
...
use
...
this
...
mechanism
...
without
...
a
...
"name
...
collision".
...
If
...
only
...
one
...
person
...
is
...
using
...
a
...
machine,
...
then
...
just
...
supply
...
a
...
placeholder
...
name.
...
If
...
there
...
is
...
more
...
than
...
one
...
user
...
on
...
the
...
computer
...
you
...
are
...
using,
...
you
...
can
...
use
...
the
...
partition
...
tag
...
parameter
...
to
...
resolve
...
conflicts.
...
If
...
you
...
use
...
your
...
login
...
name
...
as
...
the
...
partition
...
tag,
...
then
...
you
...
will
...
be
...
guaranteed
...
not
...
to
...
collide
...
with
...
anyone
...
else.
...
The
...
"-c"
...
option
...
tells
...
the
...
server
...
how
...
many
...
clients
...
it
...
should
...
allow
...
to
...
connect
...
at
...
the
...
same
...
time.
...
If
...
you
...
are
...
using
...
it
...
alone,
...
you
...
can
...
enter
...
a
...
1.
...
The
...
optional
...
argument,
...
"-l",
...
will
...
cause
...
the
...
server
...
to
...
loop
...
infinitely,
...
repetitively
...
supplying
...
all
...
the
...
events
...
in
...
the
...
file.
...
The
...
buffers
...
referred
...
to
...
above
...
are
...
in
...
the
...
shared
...
memory.
...
If
...
you
...
don't
...
need
...
the
...
shared
...
memory
...
to
...
add
...
any
...
latency
...
tolerance
...
then
...
you
...
can
...
use
...
a
...
smaller
...
number.
...
Using
...
only
...
one
...
buffer
...
will
...
serialize
...
the
...
operation
...
because
...
only
...
one
...
side
...
will
...
be
...
able
...
to
...
read
...
or
...
write
...
at
...
a
...
time.
...
The
...
minimum
...
number
...
of
...
buffers
...
used
...
should
...
be
...
two.
...
The
...
buffer
...
size
...
must
...
be
...
large
...
enough
...
for
...
the
...
largest
...
event
...
that
...
will
...
be
...
handled.
...
The
...
server
...
will
...
load
...
the
...
shared
...
memory
...
buffers
...
with
...
the
...
first
...
events
...
in
...
the
...
file
...
and
...
then
...
wait
...
for
...
the
...
client
...
to
...
start
...
reading
...
the
...
events.
...
Once
...
the
...
server
...
is
...
started,
...
you
...
can
...
start
...
the
...
client
...
side
...
in
...
the
...
second
...
shell
...
with:
| Code Block |
|---|
} ./xtcmonclientexample -p yourname -c clientId {code} |
The
...
first
...
parameter
...
that
...
must
...
be
...
given
...
to
...
the
...
client
...
software
...
is
...
the
...
partition
...
tag.
...
This
...
must
...
exactly
...
match
...
the
...
partition
...
tag
...
given
...
to
...
the
...
server
...
side
...
software.
...
The
...
parameter
...
given
...
with
...
the
...
"-c"
...
option
...
is
...
the
...
client
...
ID.
...
If
...
you
...
are
...
the
...
only
...
user,
...
then
...
just
...
give
...
it
...
a
...
value
...
of
...
zero.
...
Once
...
running
...
the
...
server
...
will
...
keep
...
supplying
...
the
...
client
...
with
...
events
...
until
...
it
...
runs
...
through
...
the
...
file.
...
It
...
will
...
then
...
exit,
...
unless
...
the
...
optional
...
"-l"
...
command
...
line
...
parameter
...
was
...
given.
...
If
...
the
...
looping
...
option
...
is
...
given
...
on
...
the
...
command
...
line,
...
then
...
the
...
server
...
will
...
endlessly
...
repeat
...
the
...
sequence
...
of
...
L1Accept
...
(Laser
...
shot)
...
events
...
in
...
the
...
file
...
and
...
will
...
not
...
terminate
...
until
...
the
...
process
...
is
...
killed.
...
Sample
...
output
...
from
...
running
...
the
...
above
...
can
...
be
...
found
...
...
.
To write your own monitoring software, all you have to do is subclass the
XtcMonitorClient class and override the XtcMonitorClient::processDgram()
...
method
...
to
...
supply
...
your
...
own
...
client
...
side
...
processing
...
of
...
the
...
DataGram
...
events
...
in
...
the
...
XTC
...
stream
...
or
...
file
...
supplied
...
by
...
the
...
file
...
server.
...
Below
...
is
...
the
...
example
...
implemented
...
by
...
XtcMonClientExample.cc.
| Code Block |
|---|
} class MyXtcMonitorClient : public XtcMonitorClient { public: virtual int processDgram(Dgram* dg) { printf("%s transition: time 0x%x/0x%x, payloadSize 0x%x\n",TransitionId::name(dg->seq.service()), dg->seq.stamp().fiducials(),dg->seq.stamp().ticks(),dg->xtc.sizeofPayload()); myLevelIter iter(&(dg->xtc),0); iter.iterate(); return 0; }; }; {code}; |
The
...
returned
...
integer
...
controls
...
whether
...
the
...
method
...
will
...
be
...
called
...
again
...
with
...
more
...
data.
...
If
...
the
...
method
...
returns
...
a
...
non
...
zero
...
value,
...
then
...
it
...
will
...
not
...
be
...
called
...
again.
...
This
...
allows
...
the
...
client
...
to
...
end
...
the
...
interaction
...
cleanly
...
if
...
it
...
chooses
...
to
...
do
...
so.
...
This
...
method
...
is
...
the
...
callback
...
from
...
the
...
client
...
monitoring
...
when
...
it
...
receives
...
a
...
buffer
...
in
...
the
...
shared
...
memory.
...
The
...
example
...
above
...
uses
...
an
...
XtcIterator
...
subclass
...
to
...
drill
...
down
...
into
...
the
...
data
...
and
...
label
...
it.
...
You
...
can
...
provide
...
your
...
own
...
functionality
...
there
...
instead.
...
Building
...
the
...
example
...
will
...
require
...
you
...
to
...
find
...
the
...
appropriate
...
shared
...
libraries
...
and
...
include
...
files.
...
The
...
data
...
format
...
definitions
...
and
...
shared
...
memory
...
support
...
are
...
in
...
a
...
package
...
called
...
'pdsdata'.
...
You
...
can
...
find
...
the
...
data
...
formats
...
in
...
include
...
files
...
in
...
this
...
directory
...
...
| Code Block |
|---|
}/reg/g/pcds/package/ana/release/pdsdata/{code} |
You
...
can
...
find
...
the
...
shared
...
libararies
...
in
...
this
...
directory...
| Code Block |
|---|
}/reg/g/pcds/package/ana/release/build/pdsdata/lib/i386-linux-opt/{code} {anchor:Writing a user application, offline analysis style} h6. Writing a user application, offline analysis style (reads from a file) Each hutch has a server machine dedicated to recording a copy of the data for use of a quick turnaround file-based analysis. In the AMO hutch, this machine is named |
| Anchor | ||||
|---|---|---|---|---|
|
...
Writing a user application, offline analysis style (reads from a file)
...
Each hutch has a server machine dedicated to recording a copy of the data for use of a
quick turnaround file-based analysis. In the AMO hutch, this machine is named daq-amo-ana01;
...
other
...
hutches
...
have
...
similarly
...
named
...
machines.
...
This
...
machine
...
"spies"
...
on
...
the
...
data
...
acquisition
...
system
...
and
...
records
...
all
...
data
...
it
...
sees,
...
whether
...
or
...
not
...
the
...
data
...
acquisition
...
system
...
is
...
directed
...
to
...
record
...
them.
...
Official
...
runs
...
(recorded
...
for
...
offline
...
analysis)
...
will
...
be
...
found
...
at
...
the
...
path
...
"/u2/pcds/pds/<hutch>/<expnum>/<expnum>-r<runnum>-s<slice>-c<chunk>.xtc".
...
Unofficial
...
runs
...
(not
...
recorded
...
for
...
offline
...
analysis)
...
will
...
be
...
found
...
at
...
a
...
similar
...
path,
...
where
...
<expnum>
...
is
...
"e0",
...
and
...
<runnum>
...
is
...
derived
...
from
...
the
...
date/time
...
and
...
can
...
be
...
found
...
in
...
the
...
DAQ
...
Control
...
message
...
window.
...
Files
...
have
...
a
...
typical
...
lifetime
...
of
...
~3
...
hours
...
on
...
this
...
server.
...
All
...
official
...
runs
...
should
...
be
...
found
...
on
...
the
...
offline
...
file
...
server
...
(/reg/d/psdm/...)
...
by
...
this
...
time.
...
The
...
"myana"
...
analysis
...
programs
...
...
...
have
...
a
...
command-line
...
paramater
...
"-L"
...
which
...
directs
...
them
...
to
...
read
...
files
...
still
...
open
...
for
...
writing.
...
This
...
changes
...
the
...
behavior
...
to
...
wait
...
for
...
more
...
data
...
when
...
end-of-file
...
is
...
reached
...
until
...
the
...
end-of-run
...
marker
...
is
...
encountered.
...
| Anchor | ||||
|---|---|---|---|---|
|
XTC playback
To test, you need to log on to a machine that has access to the xtc file
you would like to use as input data. Then,
/reg/g/pcds/dist/pds/2.12.0/build/pdsapp/bin/i386-linux-opt/xtcmonserver
...
-f
...
<xtc
...
file>
...
-s
...
0x800000
...
-p
...
<user
...
id>
...
-r
...
<event
...
rate,Hz>
...
-n
...
2
...
&
...
This
...
begins
...
serving
...
data
...
from
...
the
...
file
...
into
...
shared
...
memory
...
with
...
a
...
tag
...
derived
...
from
...
the
...
<user
...
id>
...
string.
...
The
...
event
...
rate
...
is
...
an
...
upper
...
limit;
...
i.e.
...
if
...
the
...
program
...
runs
...
faster,
...
it
...
will
...
sleep
...
to
...
to
...
achieve
...
the
...
limited
...
event
...
rate.
...
The
...
"-n"
...
argument
...
provides
...
the
...
number
...
of
...
shared
...
memory
...
buffers
...
to
...
use
...
for
...
events.
...
More
...
is
...
better,
...
but
...
you
...
may
...
need
...
to
...
alter
...
the
...
linux
...
system
...
parameters
...
to
...
allow
...
it
...
(/proc/sys/fs/mqueue/msg_max).
...
Next
...
run
...
the
...
shared
...
memory
...
client
...
applications.
...
The
...
instructions
...
below
...
are
...
for
...
running
...
the
...
core
...
online
...
monitoring
...
client
...
software
...
(to
...
test
...
a
...
plug-in
...
module,
...
for
...
example).
...
/reg/g/pcds/dist/pds/2.12.0/build/ami/bin/i386-linux-opt/ami
...
-p
...
<user
...
id>
...
-i
...
lo
...
-s
...
239.255.36.<index>
...
-L
...
<libamiusr
...
path>
...
&
...
where
...
<user
...
id>
...
is
...
the
...
same
...
string
...
as
...
above,
...
<index>
...
is
...
a
...
unique
...
number
...
from
...
0
...
to
...
255,
...
and
...
<libamiusr
...
path>
...
is
...
the
...
full
...
path
...
name
...
to
...
any
...
plug-in
...
module
...
(libamiusr.so)
...
you
...
might
...
want.
...
This
...
program
...
creates
...
a
...
process
...
that
...
parses
...
the
...
data
...
from
...
shared
...
memory,
...
performs
...
analysis
...
directed
...
from
...
the
...
GUI
...
(next
...
executable),
...
and
...
sends
...
the
...
resulting
...
plots
...
to
...
the
...
GUI.
...
Finally,
...
/reg/g/pcds/dist/pds/2.12.0/build/ami/bin/i386-linux-opt/online-ami
...
-I
...
lo
...
-i
...
lo
...
-s
...
239.255.36.<index>
...
| Wiki Markup |
|---|
where <index> is the same number (\[0..255\]) as above. This launches the GUI for display and analysis. The resulting three processes \{xtcmonserver, ami, online_ami\} work together to read, analyze, and display the data. If you need to restart any one of them, then you must restart them all. |
Overview
Content Tools