...
Going to http://www-wanmon.slac.stanford.edu/cgi-wrap/connectivity.pl?format=csv&rawdata=pinger.usindh.edu.pk&days=6&monitor=pinger.pern.edu.pk and http://www-wanmon.slac.stanford.edu/cgi-wrap/connectivity.pl?format=csv&rawdata=pingerjms.pern.edu.pk&days=6&monitor=pinger.pern.edu.pk we collected the data for past 7 days and plotted it in excel to see the curves for Average RTT and Min RTT.
Min RTT from Pern Islamabad | Average RTT from Pern Islamabad |
|---|---|
| |
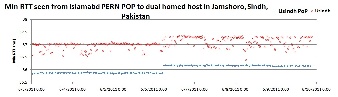
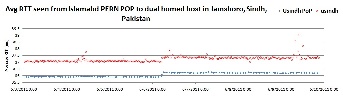
Looking at the graphs one can see that there are rapid fluctuations in the data values for each node. Because of which the graphs show a scattered plot with a number of data points above and below, which seem to be on the same point on x-axis. However looking at the spreadsheet, it is observed that two data values are collected for each half an hour, and these two values fluctuate by about 0.3 ~ 0.4 ms for PoP node while it fluctuates by 0.63ms for usndh non-PoP node. Although we don't know the reason for this fluctuation , however we know that this fluctuation is continuous for both of the nodes and for all 7 of the days.
...
pingerjms.pern.edu.pk | Min RTT (ms) | Avg RTT (ms) | Max RTT (ms) |
|---|---|---|---|
Min | 35.827 | 35.879 | 35.91 |
Avg | 36.164 02 | 36.21 07 | 36.29 16 |
Max | 36.48 203 | 36.623 293 | 37 36.934 711 |
Median | 36.159 131 | 36.201 174 | 36.264 224 |
IQR | 0.294 | 0.285 295 | 0.296 293 |
Similarly, we have the min, avg, max, median and IQR for Min RTT, Average RTT and Max RTT for the usindh node in the table shown below.
pinger.usindh.edu.pk | Min RTT (ms) | Avg RTT (ms) | Max RTT (ms) |
|---|---|---|---|
Min | 36.388 | 36.973 | 37.057 |
Avg | 37.34 04 | 37.54 23 | 37.84 511 |
Max | 37.967 352 | 39.472 032 | 46 44.352 613 |
Median | 37.311 023 | 37.614 252 | 37.711 381 |
IQR | 0.609 271 | 0.622 27 | 0.619 332 |
These tables can also be viewed in the spreadsheet attached above.
...