...
Updated several of the metrics, in particular the PingER metrics (minimum and average RTT, jitter, loss, unreachability, throughput), plus IDI, HDI, Penetration and Population. the following were not updated and hence terminate in 2010: DOI, CPI, Users.
October 2019
The frame for the chart was being displayed but with no contents.
...
Sat Oct 12 10:48:28 2019 create-motion-chart-pages.pl: finished, took 239 secs.
I followed the instructions for Enabling Flash in Chrome at https://support.digication.com/hc/en-us/articles/115003963468-Enabling-Flash-for-Google-Chrome-Windows-Macintosh-2.0.0 is installed in this browser
- Made sure Flash was enabled.
- According to https://www.whatismybrowser.com/detect/what-version-of-flash-is-installed I have version 32.0.0.
- Reloaded the web page: https://www-iepm.slac.stanford.edu/pinger/pinger-metrics-motion-chart.html.
Chrome No change.
- Viewed source and made sure change had taken effect
- Looked in Developer tools, noted the following which may be of interest
- pinger-metrics-motion-chart.html:51508 A parser-blocking, cross site (i.e. different eTLD+1) script, https://ssl.google-analytics.com/ga.js, is invoked via document.write. The network request for this script MAY be blocked by the browser in this or a future page load due to poor network connectivity. If blocked in this page load, it will be confirmed in a subsequent console message. See https://www.chromestatus.com/feature/5718547946799104 for more details.
- (anonymous) @ pinger-metrics-motion-chart.html:51508
- pinger-metrics-motion-chart.html:1 Cross-origin plugin content from must have a visible size larger than 400 x 300 pixels, or it will be blocked. Invisible content is always blocked.
Firefox No change
- Followed instructions at https://support.mozilla.org/en-US/kb/install-flash-plugin-view-videos-animations-games
- Agreed to license, manually downloaded latest Flash and completed installation
- Updated Firefox 69.0.1
- Restarted Firefox, enable Adobe Flash.
- Same result as Chrome
Umar pointed the problem was related to having no data for Normalized throughput. If one chooses another metric for the y axis default then the content is displayed.
Normalized throughput is automatically updated by prm.pl via trscrontab on pinger@pinger.slac.stanford.edu
Code Block pinger;1300 30 07 04 1 * /afs/slac.stanford.edu/package/pinger/prm/prm.pl -lp true -c /afs/slac.stanford.edu/package/pinger/prm/prm-allyearly-continent.conf #takes 11 mins on PingER 11/24/2012- Ran it manually to be sure and looked at the date updated: -rw-rw-rw- 1 pinger sf 1143 Oct 14 10:18 nthroughput-EDU.SLAC.STANFORD.PINGER-continent-allyearly.csv
- Reran create-motion-chart-pages.pl
- No change.
- Looked at the file https://www-iepm.slac.stanford.edu/pinger/prmout/nthroughput-EDU.SLAC.STANFORD.PINGER-continent-allmonthly.csv (created by prm.pl using the configuration file /afs/slac.stanford.edu/package/pinger/prm/prm-allyearly-continent.conf) and found it contained all periods ('.'). The configuration file looks OK. Reordered prm-allyearly-continent.conf and re-ran prm.pl. On the other hand the file https://www-iepm.slac.stanford.edu/pinger/prmout/throughput-EDU.SLAC.STANFORD.PINGER-country-allyearly.csv appears OK.
- Executing prm.pl with the above .conf file it appears data is available in for example https://www.slac.stanford.edu/cgi-bin/pingtable.pl?file=throughput&by=by-node&size=100&tick=allyearly&from=EDU.SLAC.STANFORD.PINGER&to=Africa&ex=none&only=all&ipv=all&dataset=hep&percentage=any, as well as for the equivalent files=minimum_rtt and file=packet_loss.
- Fixed missing single quotes (') in mon-lib.pl sub wget. Now https://www-iepm.slac.stanford.edu/pinger/prmout/nthroughput-EDU.SLAC.STANFORD.PINGER-continent-allyearly.csv has data.
- Look at source of pinger-metrics-motion-char.html, Normalized throughput is metric_index 4 in data.setValue(datapoint_index,metric_index,region), however it does not show up.
- Look at: /afs/slac/package/pinger/motion-chart/create-motion-chart-page.pl -r Europe -f EDU.SLAC.STANFORD.PINGER -t allyearly. The normalized throughput file is /afs/slac/g/www/www-iepm/pinger/prmout/nthroughput-EDU.SLAC.STANFORD.PINGER-country-allyearly.csv. However, this file (AKA https://www-iepm.slac.stanford.edu/pinger/prmout/nthroughput-EDU.SLAC.STANFORD.PINGER-country-allyearly.csv) has no data, e.g.
allyearly,?,1998,1999,2000,2001,2002,2003,2004,2005,2006,2007,2008,2009,2010,2011,2012,2013,2014,2015,2016,2017,2018,2019
EDU.SLAC.STANFORD.PINGER-to-Afghanistan,.,.,.,.,.,.,.,.,.,.,.,.,.,.,.,.,.,.,.,.,.,.,.,
EDU.SLAC.STANFORD.PINGER-to-Albania,.,.,.,.,.,.,.,.,.,.,.,.,.,.,.,.,.,.,.,.,.,.,.,
Re-ran /afs/slac.stanford.edu/package/pinger/prm/prm.pl -lp true -c /afs/slac.stanford.edu/package/pinger/prm/prm-allyearly-slac.conf to yield https://www-iepm.slac.stanford.edu/pinger/prmout/nthroughput-EDU.SLAC.STANFORD.PINGER-country-allyearly.csv AKA /afs/slac/g/www/www-iepm/pinger/prmout/nthroughput-EDU.SLAC.STANFORD.PINGER-country-allyearly.csv which has data in it.
- Reran ~cottrell/bin/create-motion-chart-pages.pl, still no Normalized throughput data in https://www-iepm.slac.stanford.edu/pinger/pinger-metrics-motion-chart.html
- There is data in /afs/slac/g/www/www-iepm/pinger/prmout/nthroughput-EDU.SLAC.STANFORD.PINGER-country-allyearly.csv AKA https://www-iepm.slac.stanford.edu/pinger/prmout/nthroughput-EDU.SLAC.STANFORD.PINGER-country-allyearly.csv
- Looking in /afs/slac/package/pinger/motion-chart/create-motion-chart-page.pl -r Europe -f EDU.SLAC.STANFORD.PINGER -t allyearly it opens (around line 968) the file /afs/slac/g/www/www-iepm/pinger/prmout/nthroughput-EDU.SLAC.STANFORD.PINGER-country-allyearly.csv and data is found there.
- Reran /afs/slac/package/pinger/motion-chart/create-motion-chart-pages.pl, still no Normalized throughput data there.
Normalized throughput is metric_index 4 in data.setValue(datapoint_index,metric_index,region). It is added around line 444 in /afs/slac/package/pinger/motion-chart/create-motion-chart-page.pl. Using perl -d /afs/slac/package/pinger/motion-chart/create-motion-chart-page.pl -r Europe -f EDU.SLAC.STANFORD.PINGER -t and halting at
Code Block 442: unless (!defined($data{"nthroughput"}->{$country}->{$interval})) { 443: if ( (($data{"nthroughput"}->{$country}->{$interval}) ne ".") 444 && (($data{"nthroughput"}->{$country}->{$interval}) ne "") 445 && (($data{"nthroughput"}->{$country}->{$interval}) != 0)){ 446: print OUTFILE " data.setValue($j, 4, " 447 . $data{"nthroughput"}->{$country}->{$interval} . ");\n"; 448 } 449 } DB<15> p "data.setValue($j, 4, $data{'nthroughput'}->{$country}->{$interval});\n" data.setValue(693, 4, 12240.9); And it is written to OUTFILE /afs/slac/g/www/www-iepm/pinger/pinger-metrics-motion-chart-Europe-EDU.SLAC.STANFORD.PINGER-allyearly.html Looking in /afs/slac/g/www/www-iepm/pinger/pinger-metrics-motion-chart-Europe-EDU.SLAC.STANFORD.PINGER-allyearly.html we see lines of the form: data.addRows(1); data.setValue(5, 0, 'Denmark'); data.setValue(5, 1, 1998); data.setValue(5, 2, 'Europe'); data.setValue(5, 3, 210.241); data.setValue(5, 4, 2919.71); #Note the metric_index=4, which is for nthroughput data.setValue(5, 16, 360.566) The metric_index of 4 is deduced from: var data = new google.visualization.DataTable(); data.addColumn('string', 'Country'); data.addColumn('number', 'Year'); data.addColumn('string', 'Region'); data.addColumn('number', 'Average RTT (ms)'); data.addColumn('number', 'Normalized Throughput (Kbps)'); data.addColumn('number', 'Population (#)'); Then we ran time /afs/slac/package/pinger/motion-chart/create-motion-chart-pages.pl It took 225 seconds. However when we look at /afs/slac/g/www/www-iepm/pinger/pinger-metrics-motion-chart.html we see: data.addRows(1); data.setValue(39, 0, 'Denmark'); data.setValue(39, 1, 1998); data.setValue(39, 2, 'Europe'); data.setValue(39, 3, 210.241); data.setValue(39, 16, 360.566) We also verified that /afs/slac/g/www/www-iepm/pinger/pinger-metrics-motion-chart-Europe-EDU.SLAC.STANFORD.PINGER-allyearly.html had not changed So the new data is not getting between create-motion-chart-page.pl to create-motion-chart-pages.pl Also: -bash-4.1$ ls -l /afs/slac/g/www/www-iepm/pinger/pinger-metrics-motion-chart-Europe-EDU.SLAC.STANFORD.PINGER-allyearly.html -rw-rw-r-- 1 pinger sf 465357 Oct 16 12:44 /afs/slac/g/www/www-iepm/pinger/pinger-metrics-motion-chart-Europe-EDU.SLAC.STANFORD.PINGER-allyearly.html Where as the file being displayed by bash-4.1$ ls -l /afs/slac/g/www/www-iepm/pinger/pinger-metrics-motion-chart.html lrwxr-xr-x 1 pinger sf 103 Jun 29 21:54 /afs/slac/g/www/www-iepm/pinger/pinger-metrics-motion-chart.html -> /afs/slac/g/www/www-iepm/pinger/pinger-metrics-motion-chart-all-EDU.SLAC.STANFORD.PINGER-allyearly.html -bash-4.1$ ls -l /afs/slac/g/www/www-iepm/pinger/pinger-metrics-motion-chart-all-EDU.SLAC.STANFORD.PINGER-allyearly.html -rw-rw-r-- 1 pinger sf 2152879 Oct 14 10:22 /afs/slac/g/www/www-iepm/pinger/pinger-metrics-motion-chart-all-EDU.SLAC.STANFORD.PINGER-allyearly.html Which is unexpected since I thought re-running create-motion-chart-pages.pl would have updated the above file to today (Oct 16). I am unclear what updated the file on Oct 14. The possible files are: bash-4.1$ ls -l /afs/slac/g/www/www-iepm/pinger/pinger-metrics-motion-chart*EDU*allyearly* -rw-rw-r-- 1 kalim sg 420174 Jun 29 18:17 /afs/slac/g/www/www-iepm/pinger/pinger-metrics-motion-chart-Africa-EDU.SLAC.STANFORD.N3-allyearly.html -rw-rw-r-- 1 pinger sf 588037 Oct 16 12:43 /afs/slac/g/www/www-iepm/pinger/pinger-metrics-motion-chart-Africa-EDU.SLAC.STANFORD.PINGER-allyearly.html -rw-rw-r-- 1 kalim sg 97918 Jun 29 18:17 /afs/slac/g/www/www-iepm/pinger/pinger-metrics-motion-chart-Balkans-EDU.SLAC.STANFORD.N3-allyearly.html -rw-rw-r-- 1 pinger sf 137858 Oct 16 12:43 /afs/slac/g/www/www-iepm/pinger/pinger-metrics-motion-chart-Balkans-EDU.SLAC.STANFORD.PINGER-allyearly.html -rw-rw-r-- 1 kalim sg 101016 Jun 29 18:17 /afs/slac/g/www/www-iepm/pinger/pinger-metrics-motion-chart-Central_Asia-EDU.SLAC.STANFORD.N3-allyearly.html -rw-rw-r-- 1 pinger sf 135565 Oct 16 12:44 /afs/slac/g/www/www-iepm/pinger/pinger-metrics-motion-chart-Central_Asia-EDU.SLAC.STANFORD.PINGER-allyearly.html -rw-rw-r-- 1 kalim sg 65743 Jun 29 18:18 /afs/slac/g/www/www-iepm/pinger/pinger-metrics-motion-chart-East_Asia-EDU.SLAC.STANFORD.N3-allyearly.html -rw-rw-r-- 1 pinger sf 73439 Oct 16 12:44 /afs/slac/g/www/www-iepm/pinger/pinger-metrics-motion-chart-East_Asia-EDU.SLAC.STANFORD.PINGER-allyearly.html -rw-rw-r-- 1 kalim sg 334304 Jun 29 18:18 /afs/slac/g/www/www-iepm/pinger/pinger-metrics-motion-chart-Europe-EDU.SLAC.STANFORD.N3-allyearly.html -rw-rw-r-- 1 pinger sf 465357 Oct 16 12:44 /afs/slac/g/www/www-iepm/pinger/pinger-metrics-motion-chart-Europe-EDU.SLAC.STANFORD.PINGER-allyearly.html -rw-rw-r-- 1 kalim sg 224179 Jun 29 18:18 /afs/slac/g/www/www-iepm/pinger/pinger-metrics-motion-chart-Latin_America-EDU.SLAC.STANFORD.N3-allyearly.html -rw-rw-r-- 1 pinger sf 310831 Oct 16 12:45 /afs/slac/g/www/www-iepm/pinger/pinger-metrics-motion-chart-Latin_America-EDU.SLAC.STANFORD.PINGER-allyearly.html -rw-rw-r-- 1 kalim sg 141526 Jun 29 18:18 /afs/slac/g/www/www-iepm/pinger/pinger-metrics-motion-chart-Middle_East-EDU.SLAC.STANFORD.N3-allyearly.html -rw-rw-r-- 1 pinger sf 209985 Oct 16 12:45 /afs/slac/g/www/www-iepm/pinger/pinger-metrics-motion-chart-Middle_East-EDU.SLAC.STANFORD.PINGER-allyearly.html -rw-rw-r-- 1 kalim sg 50387 Jun 29 18:18 /afs/slac/g/www/www-iepm/pinger/pinger-metrics-motion-chart-North_America-EDU.SLAC.STANFORD.N3-allyearly.html -rw-rw-r-- 1 pinger sf 66114 Oct 16 12:45 /afs/slac/g/www/www-iepm/pinger/pinger-metrics-motion-chart-North_America-EDU.SLAC.STANFORD.PINGER-allyearly.html -rw-rw-r-- 1 kalim sg 54170 Jun 29 18:19 /afs/slac/g/www/www-iepm/pinger/pinger-metrics-motion-chart-Oceania-EDU.SLAC.STANFORD.N3-allyearly.html -rw-rw-r-- 1 pinger sf 75277 Oct 16 12:46 /afs/slac/g/www/www-iepm/pinger/pinger-metrics-motion-chart-Oceania-EDU.SLAC.STANFORD.PINGER-allyearly.html -rw-rw-r-- 1 kalim sg 103053 Jun 29 18:19 /afs/slac/g/www/www-iepm/pinger/pinger-metrics-motion-chart-S.E._Asia-EDU.SLAC.STANFORD.N3-allyearly.html -rw-rw-r-- 1 pinger sf 149525 Oct 16 12:46 /afs/slac/g/www/www-iepm/pinger/pinger-metrics-motion-chart-S.E._Asia-EDU.SLAC.STANFORD.PINGER-allyearly.html -rw-rw-r-- 1 kalim sg 87208 Jun 29 18:19 /afs/slac/g/www/www-iepm/pinger/pinger-metrics-motion-chart-South_Asia-EDU.SLAC.STANFORD.N3-allyearly.html -rw-rw-r-- 1 pinger sf 123603 Oct 16 12:46 /afs/slac/g/www/www-iepm/pinger/pinger-metrics-motion-chart-South_Asia-EDU.SLAC.STANFORD.PINGER-allyearly.html -rw-rw-r-- 1 kalim sg 1588320 Jun 29 18:19 /afs/slac/g/www/www-iepm/pinger/pinger-metrics-motion-chart-all-EDU.SLAC.STANFORD.N3-allyearly.html -rw-rw-r-- 1 pinger sf 2152879 Oct 14 10:22 /afs/slac/g/www/www-iepm/pinger/pinger-metrics-motion-chart-all-EDU.SLAC.STANFORD.PINGER-allyearly.html lrwxr-xr-x 1 pinger sf 64 Jun 29 21:51 /afs/slac/g/www/www-iepm/pinger/pinger-metrics-motion-chart-all-EDU.SLAC.STANFORD.SLAC-allyearly.html -> /afs/slac/g/www/www-iepm/pinger/pinger-metrics-motion-chart.html Also below are the crontab entries: #Create the motion bubble plots, create-motion-chart-pages.pl takes ~ 4 mins: pinger;30 00 18 * * * /afs/slac/package/pinger/motion-chart/create-motion-chart-pages.pl # Takes ~5 minutes pinger;02 05 11 * * * /afs/slac/package/pinger/motion-chart/logs/manage-logs.pl -n 5 > /afs/slac/package/pinger/motion-chart/logs/log.stdout
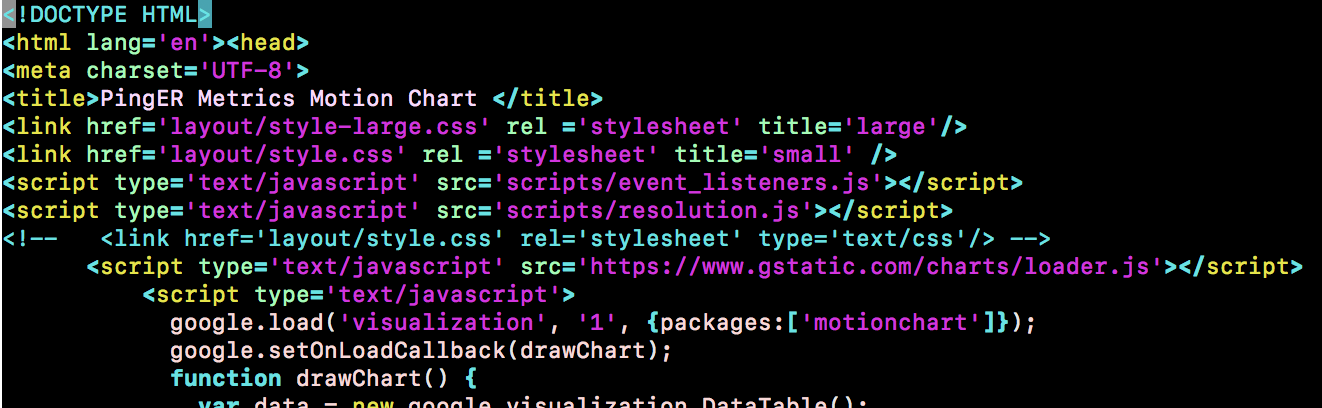
| Code Block |
|---|
<!DOCTYPE HTML>
<html lang='en'><head>
<meta charset='UTF-8'>
<title>PingER Metrics Motion Chart </title>
<link href='layout/style-large.css' rel ='stylesheet' title='large'/>
<link href='layout/style.css' rel ='stylesheet' title='small' />
<script type='text/javascript' src='scripts/event_listeners.js'></script>
<script type='text/javascript' src='scripts/resolution.js'></script>
<!--   <link href='layout/style.css' rel='stylesheet' type='text/css'/> -->
      <script type='text/javascript' src='https://www.gstatic.com/charts/loader.js'></script>
          <script type='text/javascript'>
            google.load('visualization', '1', {packages:['motionchart']});
            google.setOnLoadCallback(drawChart);
function drawChart() { |
Looked in Developer tools, noted the following which may be of interest
pinger-metrics-motion-chart.html:51508 A parser-blocking, cross site (i.e. different eTLD+1) script, https://ssl.google-analytics.com/ga.js, is invoked via document.write. The network request for this script MAY be blocked by the browser in this or a future page load due to poor network connectivity. If blocked in this page load, it will be confirmed in a subsequent console message. See https://www.chromestatus.com/feature/5718547946799104 for more details.
(anonymous) @ pinger-metrics-motion-chart.html:51508
pinger-metrics-motion-chart.html:1 Cross-origin plugin content from must have a visible size larger than 400 x 300 pixels, or it will be blocked. Invisible content is always blocked.
Tried in Firefox