Page History
...
NOTE: check for A and B cable swaps as described above using the remote link id's shown in hsdpva and kcuStatus.
Fiber Optic Powers
You can see optical powers on the kcu1500 with the pykcu command (and pvget), although see below for examples of problems so I have the impression this isn't reliable. See the timing-system section for an example of how to run pykcu. On the hsd's themselves it's not possible because the FPGA (on the hsd pcie carrier card) doesn't have access to the i2c bus (on the data card). Matt says that In principle the hsd card can see the optical power from the timing system, but that may require firmware changes.
Note: On June 4, 2024 Matt says this is working now (see later in this section for example from Matt).
Note: on the kcu1500 running "pykcu -d /dev/datadev_1 -P DAQ:CPO" this problem happens when I unplug the fiber farthest from the mini-usb connector:
Firmware upgrade from JTAG to PCIE
Install firmware newer than "hsd_6400m-0x05000100-20240424152429-weaver-b701acb.mcs".
Install datadev.ko:
- login to daq-tmo-hsd-01 or 02 In hsd-02 one needs to re-mount the filesystem as rw to make any modifications:
> sudo mount -o remount,rw / > git clone git@github.com:slaclab/aes-stream-drivers(we are at tag 6.0.1 last time we installed)> cd aes-stream-drivers/data_dev/driver> make- > sudo cp datadev.ko /usr/local/sbin/
- Create a /lib/systemd/system/kcu.service
- > sudo systemctl enable kcu.service
- > sudo systemctl start kcu.service
Modify hsd.cnf:
procmgr_config.append({host:peppex_node, id:'hsdioc_tmo_{:}'.format(peppex_hsd), port:'%d'%iport, flags:'s', env:hsd_epics_env, cmd:'hsd134PVs -P {:}_{:} -d /dev/datadev_{:}'.format(peppex_epics,peppex_hsd.upper(),peppex_hsd)})
iport += 1
So that it points to /dev/datadev/
Run :
> procmgr stopall hsd.cnf
and restart it all
> procmgr start hsd.cnf
These last 2 steps may be required to be repeated a couple of times.
Start the DAQ and send a configure. Also this step may be required to be repeated a couple of times.
Fiber Optic Powers
You can see optical powers on the kcu1500 with the pykcu command (and pvget), although see below for examples of problems so I have the impression this isn't reliable. See the timing-system section for an example of how to run pykcu. On the hsd's themselves it's not possible because the FPGA (on the hsd pcie carrier card) doesn't have access to the i2c bus (on the data card). Matt says that In principle the hsd card can see the optical power from the timing system, but that may require firmware changes.
Note: On June 4, 2024 Matt says this is working now (see later in this section for example from Matt).
Note: on the kcu1500 running "pykcu -d /dev/datadev_1 -P DAQ:CPO" this problem happens when I unplug the fiber farthest from the mini-usb connector:
| Code Block |
|---|
| Code Block |
(ps-4.5.10) drp-neh-cmp024:lcls2$ pvget DAQ:CPO:DRP_NEH_CMP024:MON DAQ:CPO:DRP_NEH_CMP024:MON 2022-03-21 16:41:49.139 RxPwr TxBiasI FullTT nFullTT 2.0993 41.806 0 0 0.0001 41.114 0 0 0.0001 41.008 0 0 0.0001 42.074 0 0 And the first number fluctuates dramatically: (ps-4.5.10) drp-neh-cmp024:lcls2$ pvget DAQ:CPO:DRP_NEH_CMP024:MON DAQ:CPO:DRP_NEH_CMP024:MON 2022-03-21 16:41:2949.127139 RxPwr TxBiasI FullTT nFullTT 32.30250993 41.946806 0 0 0.0001 41.198114 0 0 0.0001 41.014008 0 0 0.0001 42.21074 0 0 (ps- And the first number fluctuates dramatically: (ps-4.5.10) drp-neh-cmp024:lcls2$ pvget DAQ:CPO:DRP_NEH_CMP024:MON DAQ:CPO:DRP_NEH_CMP024:MON 2022-03-21 16:41:29.127 RxPwr TxBiasI FullTT nFullTT 3.3025 41.946 0 0 0.0001 41.198 0 0 0.0001 41.014 0 0 0.0001 42.21 0 0 (ps-4.5.10) drp-neh-cmp024:lcls2$ pvget DAQ:CPO:DRP_NEH_CMP024:MON DAQ:CPO:DRP_NEH_CMP024:MON 2022-03-21 16:41:39.129 RxPwr TxBiasI FullTT nFullTT 0.0001 41.872 0 0 0.0001 40.932 0 0 0.0001 40.968 0 0 0.0001 42.148 0 0 |
...
On 4/1/22 there was an unusual crash of the DAQ in SRCF. The system seemed to start up and run normally for a short while (according to grafana plots), but the AMI sources panel didn't fill in. Then many (all?) DRPs crashed (ProcStat Status window) due to not receiving a buffer in which to deposit their SlowUpdate contributions (log files). The ami-node_0 log file shows exceptions '*** Corrupt xtc: namesid 0x501 not found in NamesLookup' and similar messages. The issue was traced to there being 2 MEBs running on the same node. Both used the same 'tag' for the shared memory (the instrument name, 'tst'), which probably led to some internal confusion. Moving one of the MEBs to another node resolved the problem. Giving one of the MEBs a non-default tag (-t option) also solves the problem and allows both MEBs to run on the same node.
BOS
See Matt's information: Calient S320 ("The BOS")
Pebble Buffer Count Error
Summary: if you see "One or more DRPs have pebble buffer count > the common RoG's" in the teb log file it means that the common readout group pebble buffers needs to be made the largest either by modifying the .service file or setting the pebbleBufCount kwarg. Note that only one of the detectors in the common RoG needs to have more buffers than the non-common RoG (see example that follows).
More detailed example/explanation from Ric:
case A works (detector with number of pebble buffers):
group0: timing (8192) piran (1M)
group3: bld (1M)
case B breaks:
group0: timing (8192)
group3: bld (1M) piran (1M)
teb needs buffers to put its answers on its own local AND on the drp teb sends back an index to all drp's that is identical even timing allocates space for 1M teb answers (learns through collection that piranha has 1M and also allocates the same)
workaround was to increase dma buffers in tdetsim.service, but this potentially wastes those, really only need pebble buffers which can be individually on the command line of the drp executable with a pebbleBufCount kwarg
note that the teb compares the SUM of tx/rx buffers, which is what the pebble buf count gets set to by default, unless overridden with pebbleBufCount kwarg.
BOS
See Matt's information: Calient S320 ("The BOS")
- Create cross-connections:
curl - Create cross-connections:
curl --cookie PHPSESSID=ue5gks2db6optrkputhhov6ae1 -X POST --header "Content-Type: application/json" --header "Accept: application/json" -d "{\"in\": \"1.1.1\",\"out\": \"6.1.1\",\"dir\": \"bi\",\"band\": \"O\"}" --user admin:pxc*** "http://osw-daq-calients320.pcdsn/rest/crossconnects/?id=add" - Activate cross-connections:
curl --cookie PHPSESSID=ue5gks2db6optrkputhhov6ae1 -X POST --header "Content-Type: application/json" --header "Accept: application/json" -d "{\"in\": \"1.1.1\",\"out\": \"6.1.1\",\"dir\": \"bi\",\"band\": \"O\"}" --user admin:pxc*** "http://osw-daq-calients320.pcdsn/rest/crossconnects/?id=add" - Activate cross-connections:
curl --cookie PHPSESSID=ue5gks2db6optrkputhhov6ae1 -X POST --header "Content-Type: application/json" --header "Accept: application/json" --user admin:pxc*** "http://osw-daq-calients320.pcdsn/-user admin:pxc*** "http://osw-daq-calients320.pcdsn/rest/crossconnects/?id=activate&conn=1.1.1-6.1.1&group=SYSTEM&name=1.1.1-6.1.1"- This doesn't seem to work: Reports '
411 - Length Required'
Use the web GUI for now
- This doesn't seem to work: Reports '
- List cross-connections (easier to read in the web GUI):
curl --cookie PHPSESSID=ue5gks2db6optrkputhhov6ae1 -X GET --user admin:pxc*** 'http://osw-daq-calients320.pcdsn/rest/crossconnects/?id=list' - Save cross-connections to a file:
- Go to http://osw-daq-calients320.pcdsn/
- Navigate to
Ports→Summary - Click on '
Export CSV' in the upper left of the Port Summary table - Check in the resulting file as
lcls2/psdaq/psdaq/cnf/BOS-PortSummary.csv
XPM
Link qualification
BOS Connection CLI
Courtesy of Ric Claus. NOTE the dashes in the "delete" since you are deleting a connection name. In the "add" the two ports are joined together with a dash to create the connection name, so order of the ports matters.
| Code Block |
|---|
bos delete --deactivate 1.1.7-5.1.2
bos delete --deactivate 1.3.6-5.4.8
bos add --activate 1.3.6 5.1.2
bos add --activate 1.1.7 5.4.8 |
XPM
Link qualification
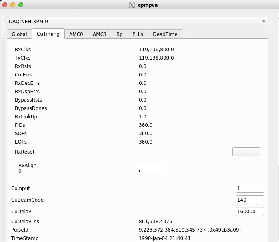
Looking at the eye diagram or bathtub curves gives really good image of the high speed links quality on the Rx side. The pyxpm_eyediagram.py tool provides a way to generate these plots for the SFPs while the Looking at the eye diagram or bathtub curves gives really good image of the high speed links quality on the Rx side. The pyxpm_eyediagram.py tool provides a way to generate these plots for the SFPs while the XPM is receiving real data.
...
Larry thinks that these are in the raw units read out from the device (mW) and says that to convert to dBm use the following formula: 10*log(10)(val/1mW). For example, 0.6 corresponds to -2.2dBm. The same information is now displayed with xpmpva in the "SFPs" tab.
| Code Block |
|---|
(ps-4.1.2) tmo-daq:scripts> pvget DAQ:NEH:XPM:0:SFPSTATUS
DAQ:NEH:XPM:0:SFPSTATUS 2021-01-13 14:36:15.450
LossOfSignal ModuleAbsent TxPower RxPower
           0            0  6.5535  6.5535
           1            0  0.5701  0.0001
           0            0  0.5883  0.7572
           0            0  0.5746  0.5679
           0            0  0.8134   0.738
           0            0  0.6844    0.88
           0            0  0.5942  0.4925
           0            0  0.5218  0.7779
           1            0   0.608  0.0001
           0            0  0.5419  0.3033
           1            0  0.6652  0.0001
           0            0  0.5177  0.8751
           1            1       0       0
0 0 0.7723 0.201 |
Programming Firmware
From Matt. He says the current production version (which still suffers from xpm-link-glitch storms) is 0x030504. The git repo with firmware is here:
https://github.com/slaclab/l2si-xpm
Please remember to stop the pyxpm process associated with the xpm before proceeding.
Connect to tmo-daq as tmoopr and use procmgr stop neh_-base.cnf pyxpm-xx.
| Code Block |
|---|
ssh drp-neh-ctl01. (with ethernet access to ATCA switch: or drp-srcf-mon001 for production hutches) ~weaver/FirmwareLoader/rhel6/FirmwareLoader -a <XPM_IPADDR> <MCS_FILE>. (binary copied from afs) ssh psdev source /cds/sw/package/IPMC/env.sh fru_deactivate shm-fee-daq01/<SLOT> fru_activate shm-fee-daq01/<SLOT> The MCS_FILE can be found at: /cds/home/w/weaver/mcs/xpm/xpm-0x03060000-20231009210826-weaver-a0031eb.mcs /cds/home/w/weaver/mcs/xpm/xpm_noRTM-0x03060000-20231010072209-weaver-a0031eb.mcs |
Incorrect Fiducial Rates
In Jan. 2023 Matt saw a failure mode where xpmpva showed 2kHz fiducial rate instead of the expected 930kHz. This was traced to an upstream accelerator timing distribution module being uninitialized.
In April 2023, DAQs run on SRCF machines had 'PGPReader: Jump in complete l1Count' errors. Matt found XPM:0 receiving 929kHz of fiducials but only transmitting 22.5kHz, which he thought was due to CRC errors on its input. Also XPM:0's FbClk seemed frozen. Matt said:
I could see the outbound fiducials were 22.5kHz by clicking one of the outbound ports LinkLoopback on. The received rate on that outbound link is then the outbound fiducial rate.
At least now we know this error state is somewhere within the XPM and not upstream.
The issue was cleared up by resetting XPM:0 with fru_deactivate/activate to clear up a bad state.
Note that when the XPMs are in a good state, the following values should be seen:
- Global tab:
- RecClk: 185 MHz
- FbClk: 185 MHz
- UsTiming tab:
- RxClks: 185 MHz
- RxLinkUp: 1
- CrcErrs: 0
- RxDecErrs: 0
- RxDspErrs: 0
- FIDs: 929 kHz
- SOFs: 929 kHz
- EOFs: 929 kHz
No RxRcv/RxErr Frames in xpmpva
If RxRcv/RxErr frames are stuck in xpmpva it may be that the network interface to the ATCA crate is not set up for jumbo frames.
Link Issues
If XPM links don't lock, here are some past causes:
- check that transceivers (especially QSFP, which can be difficult) are fully plugged in.
- for opal detectors:
- use devGui to toggle between xpmmini/LCLS2 timing (Matt has added this to the opal config script, but to the part that executes at startup time)
- hit TxPhyReset in the devGui (this is now done in the opal drp executable)
- if timing frames are stuck in a camlink node hitting TxPhyPllReset started the timing frame counters going (and it lighter-weight than xpmmini→lcls2 timing toggle)
- on a TDet node found "kcusim -T" (reset timing PLL) made a link lock
- for timing system detectors: run "kcuSim -s -d /dev/datadev_1", this should also be done when one runs a drp process on the drp node (to initialize the timing registers). the drp executable in this case doesn't need any transitions.
- hit Tx/Rx reset on xpmpva gui (AMC tabs).
- use loopback fibers (or click a loopback checkbox in xpmpva) to determine which side has the problem
- try swapping fibers in the BOS to see if the problem is on the xpm side or the kcu side
- we saw once where we have to power cycle a camlink drp node to make the xpm timing link lock. Matt suggests that perhaps hitting PLL resets in the rogue gui could be a more delicate way of doing this.
- (old information with the old/broken BOS) Valerio and Matt had noticed that the BOS sometimes lets its connections deteriorate. To fix:
- ssh root@osw-daq-calients320
- omm-ctrl --reset
Timing Frames Not Properly Received
- do TXreset on appropriate port
- toggling between xpmmini and lcls2 timing can fix (we have put this in the code now, previously was lcls1-to-lcls2 timing toggle in the code)
- sometimes xpm's have become confused and think they are receiving 26MHz timing frames when they should be 0.9MHz (this can be seen in the upstream-timing tab of xpmpva ("UsTiming"). you can determine which xpm is responsible by putting each link in loopback mode: if it is working properly you should see 0.9MHz of rx frames in loopback mode (normally 20MHz of frames in normal mode). Proceed upstream until you find a working xpm, then do tx resets (and rx?) downstream to fix them,
Network Connection Difficulty
Saw this error on Nov. 2 2021 in lab3 over and over:
| Code Block |
|---|
WARNING:pyrogue.Device.UdpRssiPack.rudpReg:host=10.0.2.102, port=8193 -> Establishing link ... |
Matt writes:
That error could mean that some other pyxpm process is connected to it. Using ping should show if the device is really off the network, which seems to be the case. You can also use "amcc_dump_bsi --all shm-tst-lab2-atca02" to see the status of the ATCA boards from the shelf manager's view. (source /afs/slac/g/reseng/IPMC/env.sh[csh] or source /cds/sw/package/IPMC/env.sh[csh]) It looks like the boards in slots 2 and 4 had lost ethernet connectivity (with the ATCA switch) but should be good now. None of the boards respond to ping, so I'm guessing its the ATCA switch that's failed. The power on that board can also be cycled with "fru_deactivate, fru_activate". I did that, and now they all respond to ping.
Firmware Varieties and Switching Between Internal/External Timing
NOTE: these instructions only apply for XPM boards running "xtpg" firmware. This is the only version that supports internal timing for the official XPM boards. It has a software-selectable internal/external timing using the "CuInput" variable. KCU1500's running the xpm firmware have a different image for internal timing with "Gen" in the name (see /cds/home/w/weaver/mcs/xpm/*Gen*, which currently contains only a KCU1500 internal-timing version).
If the xpm board is in external mode in the database we believe we have to reinitialize the database by running:
python pyxpm_db.py --inst tmo --name DAQ:NEH:XPM:10 --prod --user tmoopr --password pcds --alias XPM
CuInput flag (DAQ:NEH:XPM:0:XTPG:CuInput) is set to 1 (for internal timing) instead of 0 (external timing with first RTM SFP input, presumably labelled "EVR[0]" on the RTM, but we are not certain) or 3 (second RTM SFP timing input labelled "EVR[1]" on the RTM).
Matt says there are three types of XPM firmware: (1) an XTPG version which requires an RTM input (2) a standard XPM version which requires RTM input (3) a version which gets its timing input from AMC0 port 0 (with "noRTM" in the name). The xtpg version can take lcls1 input timing and convert to lcls2 or can generate internal lcls2 timing. Now that we have switched the tmo/rix systems to lcls2 timing this version is not needed anymore: the "xpm" firmware version should be used. The one exception is the detector group running in MFX from LCLS1 timing which currently uses xpm7 running xtpg firmware.
This file puts xpm-0 in internal timing mode: https://github.com/slac-lcls/lcls2/blob/master/psdaq/psdaq/cnf/internal-neh-base.cnf. Note that in internal timing mode the L0Delay (per-readout-group) seems to default to 90. Fix it with pvput DAQ:NEH:XPM:0:PART:0:L0Delay 80".
One should switch back to external mode by setting CuInput to 0 in xpmpva CuTiming tab. Still want to switch to external-timing cnf file after this is done. Check that the FiducialErr box is not checked (try ClearErr to see if it fixes). If this doesn't clear it can be a sign that ACR has put it "wrong divisor" on their end.
...
- python scripts/wave8DAQ.py --start_viewer 1 --l 2 (for the front-end board)
- Use this to toggle between XpmMini and LCLS2 timing (maybe with --start_viewer 0)
- python scripts/wave8DAQ.py --l 3 --enDataPath 0 --startupMode 1 (run devGui at the same time as the daq)
- As of 2024-06-06 (at least) you can run the Kcu1500 devGui with rogue6 in ps-4.6.3
Code Block python scripts/PgpMonitor.py --numLane 8 --boardType XilinxKcu1500
(new way of running kcu1500 gui from the pgp-pcie-apps/ repo, currently needs rogue5 in ps-4.6.1) python scripts/PgpMonitor.py --numLane 8 --boardType XilinxKcu1500- (OLD way of running kcu1500 gui) python scripts/PcieDebugGui.py --boardType Kcu1500 (need the flag at the end to get qsfp optical powers)
...
I was having this problem as well. I think it may have something to do with dmypy processes that hang around. If one can get this guy to restart, the problem goes away. For me, there were a bunch:
(ps-4.5.16) claus@drp-neh-ctl001:srcf$ ps -ef | grep dmypy
claus 61073 1 0 Jan07 ? 00:00:05 /cds/sw/ds/ana/conda2/inst/envs/ps-4.5.5/bin/python /cds/sw/ds/ana/conda2/inst/envs/ps-4.5.5/bin dmypy start
claus 61608 1 0 Apr01 ? 00:00:04 /cds/sw/ds/ana/conda2/inst/envs/ps-4.5.11/bin/python /cds/sw/ds/ana/conda2/inst/envs/ps-4.5.11/bin/dmypy start
claus 285627 222348 0 19:32 pts/9 00:00:00 grep dmypy
claus 353768 1 0 Jun09 ? 00:00:59 /cds/sw/ds/ana/conda2/inst/envs/ps-4.5.13/bin/python /cds/sw/ds/ana/conda2/inst/envs/ps-4.5.13/bin/dmypy start
claus 360001 1 0 Jun09 ? 00:01:02 /cds/sw/ds/ana/conda2/inst/envs/ps-4.5.13/bin/python /cds/sw/ds/ana/conda2/inst/envs/ps-4.5.13/bin/dmypy start
I tried running ami-client on a different machine, which didn’t have an issue. It also printed 'Daemon started’ whereas on the usual machine I run it on it printed 'Daemon is still alive’. When I switched back to running on the usual machine, a new daemon was started and ami-client ran cleanly.
I found on https://mypy.readthedocs.io/en/stable/mypy_daemon.html that there is a ‘dmypy stop’ command, but it doesn’t seem to stop the existing daemons, so I killed ‘em.
Controlling GMD and XGMD
to see gui's to control lcls2-timing trigger inputs:
ssh kfe-console
$ cd /cds/group/pcds/epics/ioc/kfe/gmd/R3.1.0/gmdScreens
$ ./launch_gmd_main_pcds.sh
$ ./launch_xgmd_main_pcds.sh
or go to lcls-srv01 and run "lclshome"
for lcls1-timing (outdated) can find it in "kfe" gmd/xgmd tabs and goto
waveforms and then "timing" button.
To control the BLD rate: (from Marcio)
Press the Acq. Services on the main screen. Then click on the BLD tab. Then Rate Control. And, finally, on th
e BLD1 row, click on the button with a “…”.
Make sure to hit "enter" as each field is changed (will be "purple"
until enter is hit).
/sw/ds/ana/conda2/inst/envs/ps-4.5.13/bin/dmypy start
I tried running ami-client on a different machine, which didn’t have an issue. It also printed 'Daemon started’ whereas on the usual machine I run it on it printed 'Daemon is still alive’. When I switched back to running on the usual machine, a new daemon was started and ami-client ran cleanly.
I found on https://mypy.readthedocs.io/en/stable/mypy_daemon.html that there is a ‘dmypy stop’ command, but it doesn’t seem to stop the existing daemons, so I killed ‘em.
Controlling GMD and XGMD
to see gui's to control lcls2-timing trigger inputs:
ssh kfe-console
$ cd /cds/group/pcds/epics/ioc/kfe/gmd/R3.1.0/gmdScreens
$ ./launch_gmd_main_pcds.sh
$ ./launch_xgmd_main_pcds.sh
or go to lcls-srv01 and run "lclshome"
for lcls1-timing (outdated) can find it in "kfe" gmd/xgmd tabs and goto
waveforms and then "timing" button.
To control the BLD rate: (from Marcio)
Press the Acq. Services on the main screen. Then click on the BLD tab. Then Rate Control. And, finally, on th
e BLD1 row, click on the button with a “…”.
Make sure to hit "enter" as each field is changed (will be "purple"
until enter is hit).
Note: the "rate limit" buttons don't affect anything for BLD
**********************************************************************
if someone puts gmd/xgmd in NC mode:
kfe-console:gmdScreens$ source /reg/g/pcds/pyps/conda/dev_conda
(pcds-5.7.3) kfe-console:gmdScreens$ caget TPR:FEES:MP01:0:TCRB:MODECTRL
TPR:FEES:MP01:0:TCRB:MODECTRL Crate=SC; LN=NC
(pcds-5.7.3) kfe-console:gmdScreens$
$ caget TPR:FEES:MP01:0:TCRB:MODECTRL
TPR:FEES:MP01:0:TCRB:MODECTRL Entire Crate=NC
$ caput TPR:FEES:MP01:0:TCRB:MODECTRL 3
Old : TPR:FEES:MP01:0:TCRB:MODECTRL Entire Crate=NC
New : TPR:FEES:MP01:0:TCRB:MODECTRL Crate=SC; LN=NC
(pcds-5.7.2) marcio@kfe-console ((no branch)) $ caput EM2K0:XGMD:HPS:SCSBR:FIXEDRATE 100Hz
Old : EM2K0:XGMD:HPS:SCSBR:FIXEDRATE 71.5kHz
New : EM2K0:XGMD:HPS:SCSBR:FIXEDRATE 100Hz
This is what Marcio wrote to Jeremy about someone switching timing
back to NC timing (lcls1):
Chris is talking about the crossbar control on shm-fees-sp01-1. We set SC timing to the backplane and sometim
es someone switches it back to NC.Note: the "rate limit" buttons don't affect anything for BLD
**********************************************************************
if someone puts gmd/xgmd in NC mode:
to get pv with info about bld payload on drp-srcf-cmp*:
export EPICS_PVA_SERVER_PORT=5181
export EPICS_PVA_BROADCAST_PORT=5180
export EPICS_PVA_ADDR_LIST=172.27.224.220
export EPICS_PVA_AUTO_ADDR_LIST=NOkfe-console:gmdScreens$ source /reg/g/pcds/pyps/conda/dev_conda
(pcds-5.7.3) kfe-console:gmdScreens$ caget TPR:FEES:MP01:0:TCRB:MODECTRL
TPR:FEES:MP01:0:TCRB:MODECTRL Crate=SC; LN=NC
(pcds-5.7.3) kfe-console:gmdScreens$
$ caget TPR:FEES:MP01:0:TCRB:MODECTRL
TPR:FEES:MP01:0:TCRB:MODECTRL Entire Crate=NC
$ caput TPR:FEES:MP01:0:TCRB:MODECTRL 3
Old : TPR:FEES:MP01:0:TCRB:MODECTRL Entire Crate=NC
New : TPR:FEES:MP01:0:TCRB:MODECTRL Crate=SC; LN=NCmarcio@drp-srcf-cmp001 $ pvinfo EM1K0:GMD:HPS:BLD_PAYLOAD
EM1K0:GMD:HPS:BLD_PAYLOAD
Server: 172.27.224.220:5181
Type:
epics:nt/NTScalar:1.0
structure BldPayload
float milliJoulesPerPulse
float RMS_E1
(pcds-5.7.23) marcio@kfe-console ((no branch)) $ caput marcio@drp-srcf-cmp001 $ pvinfo EM2K0:XGMD:HPS:SCSBR:FIXEDRATE 100Hz
Old : BLD_PAYLOAD
EM2K0:XGMD:HPS:SCSBR:FIXEDRATE 71.5kHz
New : EM2K0:XGMD:HPS:SCSBR:FIXEDRATE 100Hz
This is what Marcio wrote to Jeremy about someone switching timing
back to NC timing (lcls1):
Chris is talking about the crossbar control on shm-fees-sp01-1. We set SC timing to the backplane and sometim
es someone switches it back to NC.
BLD_PAYLOAD
Server: 172.27.224.220:5181
Type:
epics:nt/NTScalar:1.0
structure BldPayload
float milliJoulesPerPulse
float POSY
float RMS_E1
float RMS_E2
**********************************************************************
to get pv with info about bld payload on drp-srcf-cmp*:
**
bypassing the gateways:
(ps-4.6.0) drp-srcf-cmp025:lcls2$ cainfo export EPICS_PVA_SERVER_PORT=5181
export EPICS_PVA_BROADCAST_PORT=5180
export EPICS_PVA_ADDR_LIST=172.27.224.220
export EPICS_PVA_AUTO_ADDR_LIST=NO
(pcds-5.7.3) marcio@drp-srcf-cmp001 $ pvinfo EM1K0:GMD:HPS:BLDSTR0:STREAM_PAYLOADDOUBLE0
EM1K0:GMD:HPS:STR0:BLDSTREAM_PAYLOADDOUBLE0
Server: 172.27.224.220:5181
Type:
epics:nt/NTScalar:1.0
structure BldPayload
State: connected
Host: pscag01-daq-drp.pcdsn:35892
Access: float milliJoulesPerPulseread, write
Native data type: DBF_DOUBLE
Request type: float RMS_E1DBR_DOUBLE
Element count: 4096
(pcdsps-54.76.30) marcio@drpdrp-srcf-cmp001 $ pvinfo EM2K0:XGMD:HPS:BLD_PAYLOAD
EM2K0:XGMD:HPS:BLD_PAYLOAD
Server: 172.27.224.220:5181
Type:
epics:nt/NTScalar:1.0
structure BldPayload
float milliJoulesPerPulse
float POSY
float RMS_E1
float RMS_E2
**********************************************************************
cmp025:lcls2$ export EPICS_CA_AUTO_ADDR_LIST=NO
(ps-4.6.0) drp-srcf-cmp025:lcls2$ export EPICS_CA_ADDR_LIST=172.27.131.255:5068
(ps-4.6.0) drp-srcf-cmp025:lcls2$ cainfo EM1K0:GMD:HPS:STR0:STREAM_DOUBLE0
EM1K0:GMD:HPS:STR0:STREAM_DOUBLE0
State: connected
Host: 172.27.128.162:34555
Access: read, write
Native data type: DBF_DOUBLE
Request type: DBR_DOUBLE
Element count: 4096
(ps-4.6.0) drp-srcf-cmp025:lcls2$ export EPICS_CA_ADDR_LIST=172.27.128.162:5068bypassing the gateways:
(ps-4.6.0) drp-srcf-cmp025:lcls2$ cainfo EM1K0:GMD:HPS:STR0:STREAM_DOUBLE0
EM1K0:GMD:HPS:STR0:STREAM_DOUBLE0
State: connected
Host: pscag01-daq-drp.pcdsn:35892172.27.128.162:34555
Access: read, write
Native data type: DBF_DOUBLE
Request type: DBR_DOUBLE
Element count: 4096
(ps-4.6.0) drp-srcf-cmp025:lcls2$ ifconfig | grep "inet "
Infiniband hardware address can be incorrect! Please read BUGS section in ifconfig(8).
inet 172.21.152.46 netmask 255.255.252.0 broadcast 172.21.155.255
inet 172.21.164.46 netmask 255.255.252.0 broadcast 172.21.167.255
inet 127.0.0.1 netmask 255.0.0.0
WEKA
If weka is stuck on a node try the following, which I think requires that you be listed in the psdatmgr .k5login file (easy to do):
| Code Block |
|---|
drp-srcf-cmp007:~$ kinit Password for cpo@SLAC.STANFORD. |
...
EDU:
drp-srcf-cmp007:~$ ssh psdatmgr@drp-srcf-cmp007
Last login: Thu Jun  6 13:34:06 2024 from drp-srcf-cmp007.pcdsn
<stuff removed>
-bash-4.2$ whoami
psdatmgr
-bash-4.2$ weka status
WekaIO v4.3.1 (CLI build 4.2.7.64)

       cluster: slac-ffb (48d60028-235e-4378-8f1b-a17d711514a6)
        status: OK (48 backend containers UP, 128 drives UP)
    protection: 12+2 (Fully protected)
     hot spare: 1 failure domains (70.03 TiB)
 drive storage: 910.56 TiB total
         cloud: connected (via proxy)
       license: OK, valid thru 2032-12-16T22:03:30Z

     io status: STARTED 339 days ago (192 io-nodes UP, 252 Buckets UP)
    link layer: Infiniband + Ethernet
       clients: 343 connected, 1 disconnected
         reads: 0 B/s (0 IO/s)
        writes: 0 B/s (0 IO/s)
    operations: 29 ops/s
        alerts: 7 active alerts, use `weka alerts` to list them

-bash-4.2$ weka local status
Weka v4.2.7.64 (CLI build 4.2.7.64)
Cgroups: mode=auto, enabled=true

Containers: 1/1 running (1 weka)
Nodes: 4/4 running (4 READY)
Mounts: 1

To view additional information run 'weka local status -v'
-bash-4.2$ |
Overview
Content Tools