Page History
...
- Matt's timing system firmware is available in GitHub here: https://github.com/slaclab/l2si-drp/releases/tag/v4.0.2
- When only one datadev device is found in /dev or /proc when two are expected, the BIOS PCIe bifurcation parameter may need to be changed from "auto" or "x16" to "x8x8" for the NUMA node (slot) containing the PCIe bus holding the KCU card
- If the BIOS PCIe bifurcation parameter seems to be missing (was the case for the SRCF DRP machines), the BIOS version may be out of date and need updating. See Updating the BIOS.
- kcuSim -t (resets timing counters)
- In some cases has fixed link-unlocked issues: kcuSim -T (reset timing PLL)
- kcuSim -s (dumps stats)
- kcuSim -c (setup clock synthesizers)
- Watch for these errors: RxDecErrs 0 RxDspErrs 0
- reload the driver with "systemctl restart tdetsim"
- currently driver is in /usr/local/sbin/datadev.ko, should be in /lib/modules/<kernel>/extra/
- reloading the driver does a soft-reset of the KCU (resetting buffer pointers etc.).
- if the soft-reset doesn't work, power-cycle is the hard-reset.
- program with this command: "python software/scripts/updatePcieFpga.py --path ~weaver/mcs/drp --dev /dev/datadev_1" (datadev_1 if we're overwriting a TDET kcu, or could be a datadev_0 if we're overwriting another firmware image)
Using TDet with pgpread
Need to enable DrpTDet detectors with "kcuSim -C 2" or "kcuSim -C 2,0,0" where second argument is sim-length (0 for real data) and third arg is linkmask (can be in hex). first arg is readout group. use readout group >7 to disable, e.g. kcuSim -C 8,0,0xff to disable all
Fiber Optic Powers
To see the optical powers Matt says we should run the software in psdaq/psdaq/pykcu (the second argument is a base name for exported epics vars). Same commands work for hsd kcu1500. NOTE: cpo thinks that we may have to use datadev_1 here. I tried with datadev_0 but received an epics timeout from pvget. NOTE: Fiber power readout only works with QSFP's not the "SFP converter" modules we typically use for tdetsim kcu's.
...
As of Jan. 20, 2021, Matt has production DrpTDet and DrpPgpIlv firmware here:
- https://github.com/slaclab/l2si-drp
- ~weaver/mcs/DrpTDet-20200612*.mcs (tdetsim)
- /afs/slac/u/ec/weaver/projects/cameralink-gateway/firmware/targets/ClinkKcu1500Pgp2b/images/ClinkKcu1500Pgp2b-0x04090000-20201125220148-weaver-dirty*.mcs (timetool opal, but compatible with normal opal ... he will merge into Larry's repo).
...
NOTE: check for A and B cable swaps as described above using the remote link id's shown in hsdpva and kcuStatus.
Fiber Optic Powers
You can see optical powers on the kcu1500 with the pykcu command (and pvget), although see below for examples of problems so I have the impression this isn't reliable. See the timing-system section for an example of how to run pykcu. On the hsd's themselves it's not possible because the FPGA (on the hsd pcie carrier card) doesn't have access to the i2c bus (on the data card). Matt says that In principle the hsd card can see the optical power from the timing system, but that may require firmware changes.
Note: on the kcu1500 running "pykcu -d /dev/datadev_1 -P DAQ:CPO" this problem happens when I unplug the fiber farthest from the mini-usb connector:
Firmware upgrade from JTAG to PCIE
Install firmware newer than "hsd_6400m-0x05000100-20240424152429-weaver-b701acb.mcs".
Install datadev.ko:
- login to daq-tmo-hsd-01 or 02 In hsd-02 one needs to re-mount the filesystem as rw to make any modifications:
> sudo mount -o remount,rw / > git clone git@github.com:slaclab/aes-stream-drivers(we are at tag 6.0.1 last time we installed)> cd aes-stream-drivers/data_dev/driver> make- > sudo cp datadev.ko /usr/local/sbin/
- Create a /lib/systemd/system/kcu.service
- > sudo systemctl enable kcu.service
- > sudo systemctl start kcu.service
Modify hsd.cnf:
procmgr_config.append({host:peppex_node, id:'hsdioc_tmo_{:}'.format(peppex_hsd), port:'%d'%iport, flags:'s', env:hsd_epics_env, cmd:'hsd134PVs -P {:}_{:} -d /dev/datadev_{:}'.format(peppex_epics,peppex_hsd.upper(),peppex_hsd)})
iport += 1
So that it points to /dev/datadev/
Run :
> procmgr stopall hsd.cnf
and restart it all
> procmgr start hsd.cnf
These last 2 steps may be required to be repeated a couple of times.
Start the DAQ and send a configure. Also this step may be required to be repeated a couple of times.
Fiber Optic Powers
You can see optical powers on the kcu1500 with the pykcu command (and pvget), although see below for examples of problems so I have the impression this isn't reliable. See the timing-system section for an example of how to run pykcu. On the hsd's themselves it's not possible because the FPGA (on the hsd pcie carrier card) doesn't have access to the i2c bus (on the data card). Matt says that In principle the hsd card can see the optical power from the timing system, but that may require firmware changes.
Note: On June 4, 2024 Matt says this is working now (see later in this section for example from Matt).
Note: on the kcu1500 running "pykcu -d /dev/datadev_1 -P DAQ:CPO" this problem happens when I unplug the fiber farthest from the mini-usb connector:
| Code Block |
|---|
(ps-4.5.10) |
| Code Block |
(ps-4.5.10) drp-neh-cmp024:lcls2$ pvget DAQ:CPO:DRP_NEH_CMP024:MON DAQ:CPO:DRP_NEH_CMP024:MON 2022-03-21 16:41:49.139 RxPwr TxBiasI FullTT nFullTT 2.0993 41.806 0 0 0.0001 41.114 0 0 0.0001 41.008 0 0 0.0001 42.074 0 0 And the first number fluctuates dramatically: (ps-4.5.10) drp-neh-cmp024:lcls2$ pvget DAQ:CPO:DRP_NEH_CMP024:MON DAQ:CPO:DRP_NEH_CMP024:MON 2022-03-21 16:41:2949.127139 RxPwr TxBiasI FullTT nFullTT 32.30250993 41.946806 0 0 0.0001 41.198114 0 0 0.0001 41.014008 0 0 0.0001 42.21074 0 0 And the first number fluctuates dramatically: (ps-4.5.10) drp-neh-cmp024:lcls2$ pvget DAQ:CPO:DRP_NEH_CMP024:MON DAQ:CPO:DRP_NEH_CMP024:MON 2022-03-21 16:41:3929.129127 RxPwr TxBiasI FullTT nFullTT 03.00013025 41.872946 0 0 0.0001 4041.932198 0 0 0.0001 4041.968014 0 0 0.0001 42.14821 0 0 |
When I plug the fiber back in I see significant changes but the first number continues to fluctuate dramatically:
| Code Block |
|---|
(ps-4.5.10) drp-neh-cmp024:lcls2$ pvget DAQ:CPO:DRP_NEH_CMP024:MON DAQ:CPO:DRP_NEH_CMP024:MON 2022-03-21 16:4541:1939.343129 RxPwr TxBiasI FullTT nFullTT 10.17350001 41.918872 0 0 0.7440001 4140.17932 0 0 0.45440001 4140.008968 0 0 0.64710001 42.032148 0 0 |
When I plug the fiber back in I see significant changes but the first number continues to fluctuate dramatically:
| Code Block |
|---|
(ps-4.5.10) drp-neh-cmp024:lcls2$ pvget DAQ:CPO:DRP_NEH_CMP024:MON DAQ:CPO:DRP_NEH_CMP024:MON 2022-03-21 16:45:39.19.343 RxPwr TxBiasI FullTT nFullTT 1.1735 41.918 0 0 0.744 41.17 0 0 0.4544 41.008 0 0 0.6471 42.032 0 0 (ps-4.5.10) drp-neh-cmp024:lcls2$ pvget DAQ:CPO:DRP_NEH_CMP024:MON DAQ:CPO:DRP_NEH_CMP024:MON 2022-03-21 16:45:39.363 RxPwr TxBiasI FullTT nFullTT 0.4084 41.972 0 0 0.7434 41.126 0 0 0.4526 41.014 0 0 0.6434 42.014 0 0 |
...
| Code Block |
|---|
(ps-4.5.10) drp-neh-cmp024:lcls2$ pvget DAQ:CPO:DRP_NEH_CMP024:MON
DAQ:CPO:DRP_NEH_CMP024:MON 2022-03-21 16:47:40.762
RxPwr TxBiasI FullTT nFullTT
    0       0      0       0
    0       0      0       0
    0       0      0       0
0 0 0 0 |
No Phase 2
There have been several instances of not being able to get phase 2 of Configure though an HSD DRP. At least some of these were traced to kcuStatus showing 131 MHz instead of the required 156 MHz. This can happen if the tdetsim service starts instead of kcu.service. Sometimes, no amount of kcuStatus -I or kcuStatus -R restores proper operation. In this case the KCU FPGA may be in a messed up state, so power cycle the node to get the FPGA to reload.
PvaDetector
- If you're seeing std::bad_alloc, see note above in 'datadev Driver' about configuring tdetsim.service
- use "-vvv" to get printout of timestamp matching process
- options to executable: "-1" is fuzzy timestamping, "-0" is no timestamp matching, and no argument is precise timestamp matching.
- the IP where the PV is served might not be the same as the IP returned by a ping. For example: ping ctl-kfe-cam-02 returns 172.21.92.80, but the PV is served at 172.21.156.96
- netconfig can be used to determine the IP where the PV is served. For example:
/reg/common/tools/bin/netconfig search ctl-kfe-cam-02-drp
ctl-kfe-cam-02-drp:
subnet: daq-drp-neh.pcdsn
Ethernet Address: b4:2e:99:ab:14:4f
IP: 172.21.156.96
Contact: uid=velmir,ou=People,dc=reg,o=slac
PC Number: 00000
Location: Same as ctl-kfe-cam-02
Description: DRP interface for ctl-kfe-cam-02
Puppet Classes:Found 1 entries that match ctl-kfe-cam-02-drp.
Fake Camera
- use this to check state of the pgp link, and the readout group, size and link mask (instead of kcuStatus): kcuSim -s -d /dev/datadev_0
- use this to configure readout group, size, link mask: kcuSimValid -d /dev/datadev_0 -c 1 -C 2,320,0xf
- I think this hangs because it's trying to validate a number of events (specified with the -c argument?)
configdb Utility
From Chris Ford. See also ConfigDB and DAQ configdb CLI Notes. Supports ls/cat/cp. NOTE: when copying across hutches it's important to specify the user for the destination hutch. For example:
| Code Block |
|---|
configdb cp --user rixopr --password <usual> --write tmo/BEAM/tmo_atmopal_0 rix/BEAM/atmopal_0 |
Storing (and Updating) Database Records with <det>_config_store.py
Detector records can be defined and then stored in the database using the <det>_config_store.py scripts. For a minimal model see the hrencoder_config_store.py which has just a couple additional entries beyond the defaults (which should be stored for every detector).
Once the record has been defined in the script, the script can be run with a few command-line arguments to store it in the database.
The following call should be appropriate for most use cases.
| Code Block |
|---|
python <det>_config_store.py --name <unique_detector_name> [--segm 0] --inst <hutch> --user <usropr> --password <usual> [--prod] --alias BEAM |
Verify the following:
- User and hutch (
--inst) as defined in the cnf file for the specific configuration and include as--user <usr>. This is used for HTTP authentication. E.g.,tmoopr,tstopr - Password is the standard password used for HTTP authentication.
- Include
--prodif using the production database. This will need to match the entry in yourcnffile as well, defined ascdb.https://pswww.slac.stanford.edu/ws-auth/configdb/wsis the production database. - Do not include the segment number in the detector name. If you are updating an entry for a segment other than 0, pass
–sgem $SEGMin addition to–name $DETNAME
python <det>_config_store.py --help is available and will display all arguments.
There are similar scripts that can be used to update entries. E.g.:
hsd_config_update.py
Making Schema Updates in configdb
i.e. changing the structure of an object while keeping existing values the same. An example from Ric: "Look at the __main__ part of epixm320_config_store.py. Then run it with --update. You don’t need the bit regarding args.dir. That’s for uploading .yml files into the configdb."
Here's an example from Matt: python /cds/home/opr/rixopr/git/lcls2_041224/psdaq/psdaq/configdb/hsd_config_update.py --prod --inst tmo --alias BEAM --name hsd --segm 0 --user tmoopr --password XXXX
MCC Epics Archiver Access
Matt gave us a video tutorial on how to access the MCC epics archiver.
| View file | ||||
|---|---|---|---|---|
|
TEB/MEB
(conversation with Ric on 06/16/20 on TEB grafana page)
BypCt: number bypassing the TEB
BtWtg: boolean saying whether we're waiting to allocate a batch
TxPdg (MEB, TEB, DRP): boolean. libfabric saying try again to send to the designated destination (meb, teb, drp)
RxPdg (MEB, TEB, DRP): same as above but for Rx.
(T(eb)M(eb))CtbOInFlt: incremented on a send, decremented on a receive (hence "in flight")
In tables at the bottom: ToEvtCnt is number of events timed out by teb
WrtCnt MonCnt PsclCnt: the trigger decisions
TOEvtCnt TIEvtCnt: O is outbound from drp to teb, I is inbound from teb to drp
Look in teb log file for timeout messages. To get contributor id look for messages like this in drp:
/reg/neh/home/cpo/2020/06/16_18:19:24_drp-tst-dev010:tmohsd_0.log:Parameters of Contributor ID 8:
Conversation from Ric and Valerio on the opal file-writing problem (11/30/2020):
I was poking around with daqPipes just to familiarize myself with it and I was looking at the crash this morning at around 8.30. I noticed that at 8.25.00 the opal queue is at 100% nd teb0 is starting to give bad signs (again at ID0, from the bit mask) However, if I make steps of 1 second, I see that it seems to recover, with the queue occupancy dropping to 98, 73 then 0. However, a few seconds later the drp batch pool for all the hsd lists are blocked. I would like to ask you (answer when you have time, it is just for me to understand): is this the usual Opal problem that we see? Why does it seem to recover before the batch pool blocks? I see that the first batch pool to be exhausted is the opal one. Is this somehow related?
- I’ve still been trying to understand that one myself, but keep getting interrupted to work on something else, so here is my perhaps half baked thought: Whatever the issue is that blocks the Opal from writing, eventually goes away and so it can drain. The problem is that that is so late that the TEB has started timing out a (many?) partially built event(s). Events for which there is no contributor don’t produce a result for the missing contributor, so if that contributor (sorry, DRP) tried to produce a contribution, it never gets an answer, which is needed to release the input batch and PGP DMA buffer. Then when the system unblocks, a SlowUpdate (perhaps, could be an L1A, too, I think) comes along with a timestamp so far in the future that it wraps around the batch pool, a ring buffer. This blocks because there might already be an older contribution there that is waiting to be released. It scrambles my brain to think about, so apologies if it isn’t clear. I’m trying to think of a more robust way to do it, but haven’t gotten very far yet.
- One possibility might be for the contributor/DRP to time out the input buffer in EbReceiver, so that if a result matching that input never arrives, the input buffer and PGP buffer are released. This could produce some really complicated failure modes that are hard to debug, because the system wouldn’t stop. Chris discouraged me from going down that path for fear of making things more complicated, rightly so, I think.
If a contribution is missing, the *EBs time it out (4 seconds, IIRR), then mark the event with DroppedContribution damage. The Result dgram (TEB only, and it contains the trigger decision) receives this damage and is sent to all contributors that the TEB heard from for that event. Sending it to contributors it didn’t hear from might cause problems because they might have crashed. Thus, if there’s damage raised by the TEB, it appears in all contributions that the DRPs write to disk and send to the monitoring. This is the way you can tell in the TEB Performance grafana plots whether the DRP or the TEB is raising the damage.
Ok thank you. But when you say: "If that contributor (sorry, DRP) tried to produce a contribution, it never gets an answer, which is needed to release the input batch and PGP DMA buffer". I guess you mean that the DRP tries to collect a contribution for a contributor that maybe is not there. But why would the DRP try to do that? It should know about the damage from the TEB's trigger decision, right? (Do not feel compelled to answer immediately, when you have time)
The TEB continues to receive contributions even when there’s an incomplete event in its buffers. Thus, if an event or series of events is incomplete, but a subsequent event does show up as complete, all those earlier incomplete events are marked with DroppedContribution and flushed, with the assumption they will never complete. This happens before the timeout time expires. If the missing contributions then show up anyway (the assumption was wrong), they’re out of time order, and thus dropped on the floor (rather than starting a new event which will have the originally found contributors in it missing (Aaah, my fingers have form knots!), causing a split event (don’t know if that’s universal terminology)). A split event is often indicative of the timeout being too short.
- The problem is that the DRP’s Result thread, what we call EbReceiver, if that thread gets stuck, like in the Opal case, for long enough, it will backpressure into the TEB so that it hangs in trying to send some Result to the DRPs. (I think the half-bakedness of my idea is starting to show…) Meanwhile, the DRPs have continued to produce Input Dgrams and sent them to the TEB, until they ran out of batch buffer pool. That then backs up in the KCU to the point that the Deadtime signal is asserted. Given the different contribution sizes, some DRPs send more Inputs than others, I think. After long enough, the TEB’s timeout timer goes off, but because it’s paralyzed by being stuck in the Result send(), nothing happens (the TEB is single threaded) and the system comes to a halt. At long last, the Opal is released, which allows the TEB to complete sending its ancient Result, but then continues on to deal with all those timed out events. All those timed out events actually had Inputs which now start to flow, but because the Results for those events have already been sent to the contributors that produced their Inputs in time, the DRPs that produced their Inputs late never get to release their Input buffers.
A thought from Ric on how shmem buffer sizes are calculated:
- If the buffer for the Configure dgram (in /usr/lib/systemd/system/tdetsim.service) is specified to be larger, it wins. Otherwise it’s the Pebble buffer size. The Pebble buffer size is derived from the tdetsim.service cfgSize, unless it’s overridden by the pebbleBufSize kwarg to the drp executable
On 4/1/22 there was an unusual crash of the DAQ in SRCF. The system seemed to start up and run normally for a short while (according to grafana plots), but the AMI sources panel didn't fill in. Then many (all?) DRPs crashed (ProcStat Status window) due to not receiving a buffer in which to deposit their SlowUpdate contributions (log files). The ami-node_0 log file shows exceptions '*** Corrupt xtc: namesid 0x501 not found in NamesLookup' and similar messages. The issue was traced to there being 2 MEBs running on the same node. Both used the same 'tag' for the shared memory (the instrument name, 'tst'), which probably led to some internal confusion. Moving one of the MEBs to another node resolved the problem. Giving one of the MEBs a non-default tag (-t option) also solves the problem and allows both MEBs to run on the same node.
BOS
See Matt's information: Calient S320 ("The BOS")
- Create cross-connections:
curl --cookie PHPSESSID=ue5gks2db6optrkputhhov6ae1 -X POST --header "Content-Type: application/json" --header "Accept: application/json" -d "{\"in\": \"1.1.1\",\"out\": \"6.1.1\",\"dir\": \"bi\",\"band\": \"O\"}" --user admin:pxc*** "http://osw-daq-calients320.pcdsn/rest/crossconnects/?id=add" - Activate cross-connections:
curl --cookie PHPSESSID=ue5gks2db6optrkputhhov6ae1 -X POST --header "Content-Type: application/json" --header "Accept: application/json" --user admin:pxc*** "http://osw-daq-calients320.pcdsn/rest/crossconnects/?id=activate&conn=1.1.1-6.1.1&group=SYSTEM&name=1.1.1-6.1.1"- This doesn't seem to work: Reports '
411 - Length Required'
Use the web GUI for now
- This doesn't seem to work: Reports '
- List cross-connections (easier to read in the web GUI):
curl --cookie PHPSESSID=ue5gks2db6optrkputhhov6ae1 -X GET --user admin:pxc*** 'http://osw-daq-calients320.pcdsn/rest/crossconnects/?id=list' - Save cross-connections to a file:
- Go to http://osw-daq-calients320.pcdsn/
- Navigate to
Ports→Summary - Click on '
Export CSV' in the upper left of the Port Summary table - Check in the resulting file as
lcls2/psdaq/psdaq/cnf/BOS-PortSummary.csv
XPM
Link qualification
Looking at the eye diagram or bathtub curves gives really good image of the high speed links quality on the Rx side. The pyxpm_eyediagram.py tool provides a way to generate these plots for the SFPs while the XPM is receiving real data.
How to use (after loading conda env.)
| Code Block |
|---|
python pyxpm_eyescan.py --ip {XPM_IP_ADDR} --link {AMC_LINK[0:13]} [--hseq {VALUE}] [--eye] [--bathtub] [--gui] [--forceLoopback] [--target {VALUE}] |
Where:
- hseq VALUE: set the high speed equalizer value (see: High-speed repeater configuration below)
- eye: ask for eye diagram generation
- bathtub: ask for the bathtub curve generation
- gui: open debugging view
- forceLoopback: set the link in loopback during the qualification run
High-speed repeater configuration ("equalizer" settings)
High speed repeater, located on the AMC cards, which repeat (clean) the link from/to SFP/FPGA, have to be configured. The equalizer default value does not provide a safe environment and link might not lock with this configuration.
How to use (after loading conda env.). Note that XPM_ID is the usual DAQ ID number (e.g. zero is the supervisor xpm in room 208). This allows Julian's software to talk to the right epics registers:
| Code Block |
|---|
python pyxpm_hsrepeater.py --ip {XPM_IP_ADDR} --xpmid {XPM_ID} --link {AMC_LINK[0:13]} |
What:
- Runs a equalizer scan and reports the link status for each value
- Set a value where no error have been detected in the middle of the working window (the tool does not automatically set the best value)
See results here: Link quality and non-locking issue
An example for XPM 10, AMC 1, Link 3:
| Code Block |
|---|
(ps-4.6.2) claus@drp-neh-ctl002:neh$ python ~/lclsii/daq/lcls2/psdaq/psdaq/pyxpm/pyxpm_hsrepeater.py --ip 10.0.5.102 --xpmid 10 --link 10
Rogue/pyrogue version v5.18.4. https://github.com/slaclab/rogue
Start: Started zmqServer on ports 9103-9105
    To start a gui: python -m pyrogue gui --server='localhost:9103'
    To use a virtual client: client = pyrogue.interfaces.VirtualClient(addr='localhost', port=9103)
Scan equalizer settings for link 10 / XPM 10
    Link[10] status (eq=00): Ready (Rec: 20635200 - Err: 0)
    Link[10] status (eq=01): Ready (Rec: 20635200 - Err: 0)
    Link[10] status (eq=02): Ready (Rec: 20635200 - Err: 0)
    Link[10] status (eq=03): Ready (Rec: 20635201 - Err: 0)
    Link[10] status (eq=07): Ready (Rec: 20635200 - Err: 0)
    Link[10] status (eq=15): Ready (Rec: 20635200 - Err: 0)
    Link[10] status (eq=0B): Ready (Rec: 20635201 - Err: 0)
    Link[10] status (eq=0F): Ready (Rec: 20635200 - Err: 0)
    Link[10] status (eq=55): Ready (Rec: 20635200 - Err: 0)
    Link[10] status (eq=1F): Ready (Rec: 20635200 - Err: 0)
    Link[10] status (eq=2F): Ready (Rec: 20635200 - Err: 0)
    Link[10] status (eq=3F): Ready (Rec: 20635200 - Err: 0)
    Link[10] status (eq=AA): Ready (Rec: 20635200 - Err: 0)
    Link[10] status (eq=7F): Ready (Rec: 20635200 - Err: 0)
    Link[10] status (eq=BF): Ready (Rec: 3155 - Err: 5702)
    Link[10] status (eq=FF): Not ready (Rec: 0 - Err: 9139)
    [Configured] Set eq = 0x00
^CException ignored in: <module 'threading' from '/cds/sw/ds/ana/conda2/inst/envs/ps-4.6.2/lib/python3.9/threading.py'>
Traceback (most recent call last):
  File "/cds/sw/ds/ana/conda2/inst/envs/ps-4.6.2/lib/python3.9/threading.py", line 1477, in _shutdown
    lock.acquire()
KeyboardInterrupt: |
Crate ID is 5 according to the table in Shelf Managers below, and slot is 2 according to the crate photos below. Ctrl-C must be given to terminate the program.
NEH Topology
Before May 2021:
https://docs.google.com/drawings/d/1IX8qFco1tY_HJFdK-UTUKaaP_ZYb3hr3EPJJQS65Ffk/edit?usp=sharing
Now (May 2021):
https://docs.google.com/drawings/d/1clqPlpWZiohWoOaAN9_qr4o06H0OlCHBqAirVo9CXxo/edit?usp=sharing
Eventually:
https://docs.google.com/drawings/d/1alpt4nDkSdIxZRQdHMLxyvG5HsCrc7kImiwGUYAPHSE/edit?usp=sharing
XPM topology after recabling for SRCF (May 10, 2023):
| Code Block |
|---|
globalTiming -> newxpm0 -> 2 (tmo) -> 4 (tmo)
                                   -> 6 (208) -> BOS
                        -> 3 (rix) -> 5 (208) -> BOS
                                   -> 1 (rix)
XPM0 (208) -> 10 (fee) -> 11(fee) |
NEH Connections
From xpmpva on Oct. 31, 2022.
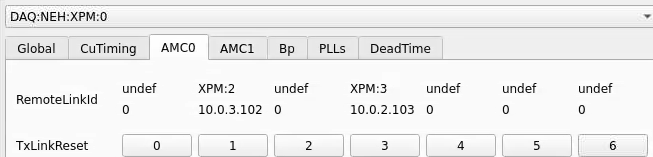
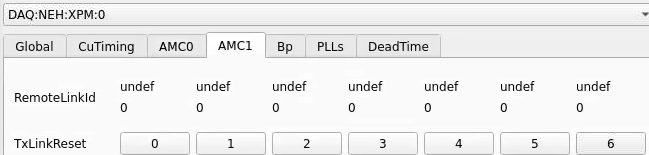
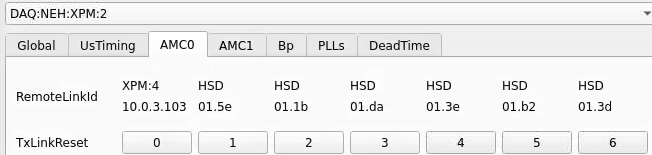
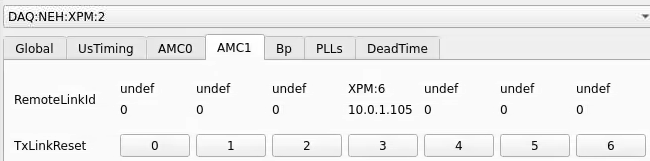
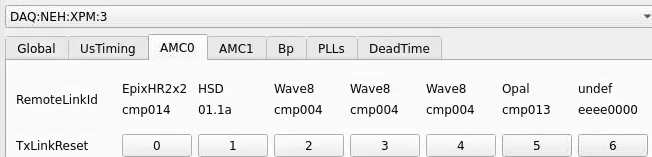
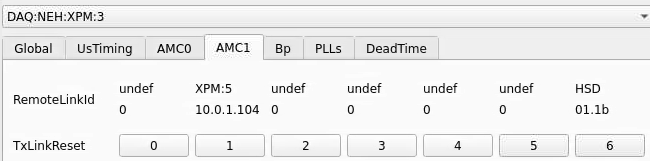
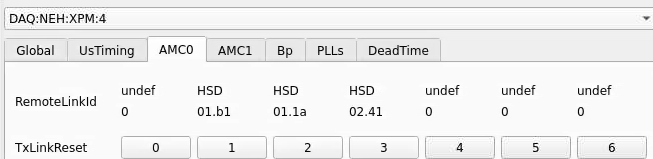
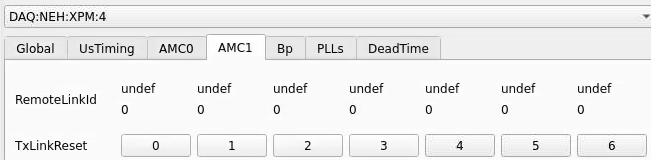
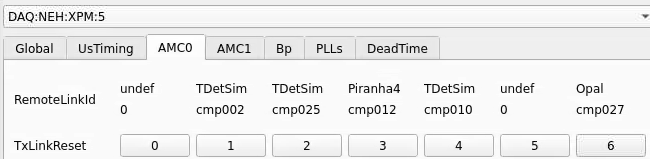
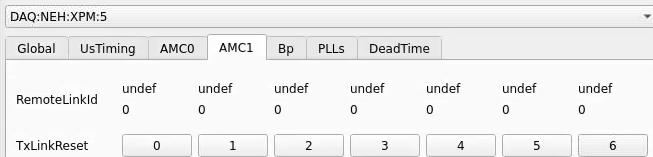
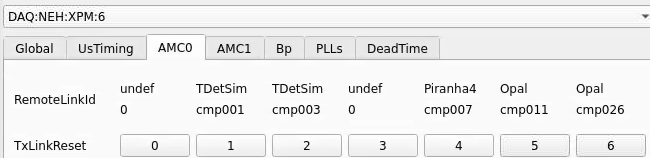
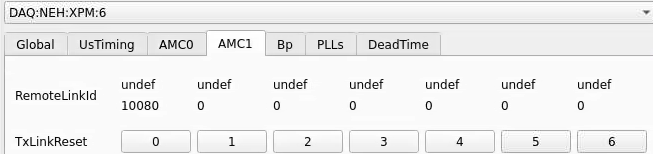
Numbering
amc1 on left, amc0 on right
ports count 0-6 from right to left, matching labelling on xpm, but opposite the order in xpmpva which goes left to right
LEFTMOST PORT IS UNUSED (labelled 7 on panel)
in fee, xpm0 was lowest slot (above switch), xpm1 one up
pyxpm 2 is fee (currently the master), 4 is hutch, 3 unused
epics numbering of xpm 0 2 1
IP Addresses
From Matt: The ATCA crate in the FEE has a crate number that must differ from the other crates on the network. That crate number comes from the shelf manager. So, when we get a shelf manager, we'll need to set its crate ID. That determines the third byte for all the IP addresses in the crate. 10.0.<crate>.<slot+100>. See LCLS-II: Generic IPMC Commands#HowtosetupATCAcrateID for setting the ATCA crate ID.
An example session from Matt:
| Code Block |
|---|
[weaver@psdev02 ~]$ ssh root@shm-neh-daq02
key_load_public: invalid format
Warning: Permanently added 'shm-neh-daq02,172.21.156.127' (RSA) to the list of known hosts.
root@shm-neh-daq02's password:
sh: /usr/bin/X11/xauth: not found
# clia shelfaddress
Pigeon Point Shelf Manager Command Line Interpreter
Shelf Address Info: "L2SI_0002" |
Timing Link Glitches
LCLS1
Timing Missing
Matt writes that he logs in lcls-srv01 (see below) and launches "lclshome" to see that the LCLS1 timing is down. If you see an "xcb" error it means X-forwarding is broken, perhaps because of a bad key in .ssh/known_hosts.
Matt says to look at the "Event" row:
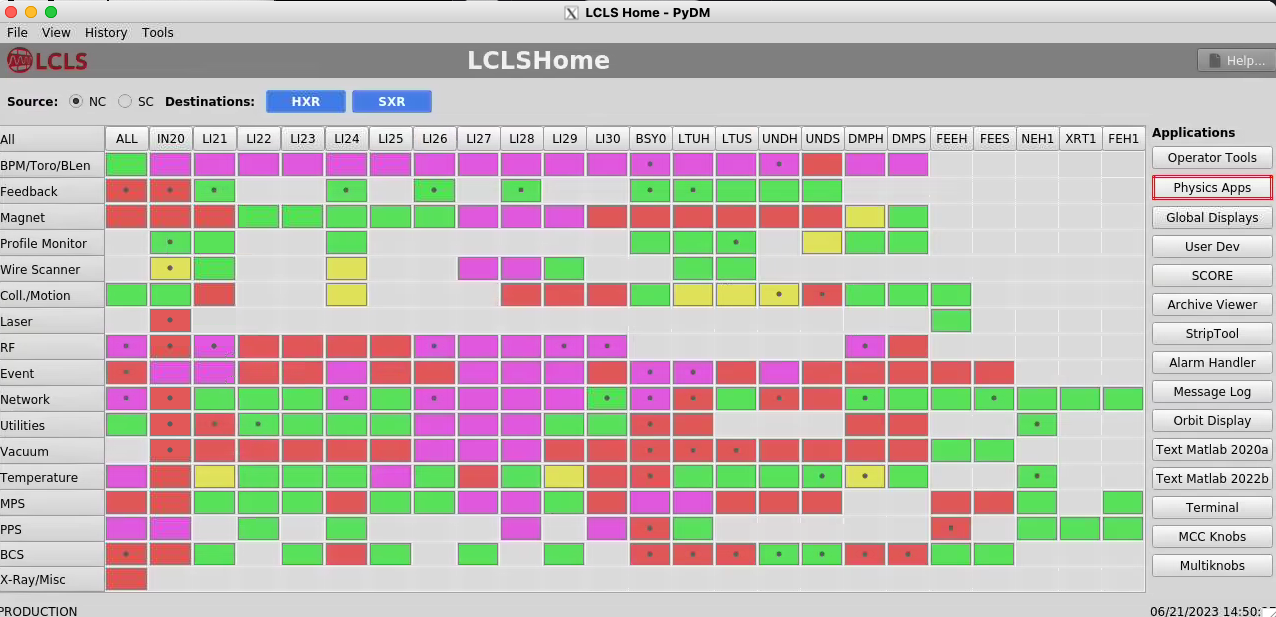
Timing Not Down-Sampled Correctly
Debugging with Matt on March 12, 2024
Matt says you can see this with epics on lcls-srv01:
| Code Block |
|---|
[softegr@lcls-srv01 ~ ]$ caget IOC:GBL0:EV02:SyncFRQMHZ
IOC:GBL0:EV02:SyncFRQMHZ 8.44444 |
Here's a screen shot from LCLS home that shows it. I'm just looking at it for the first time. Where it says 8.53 MHz should be 71 kHz.
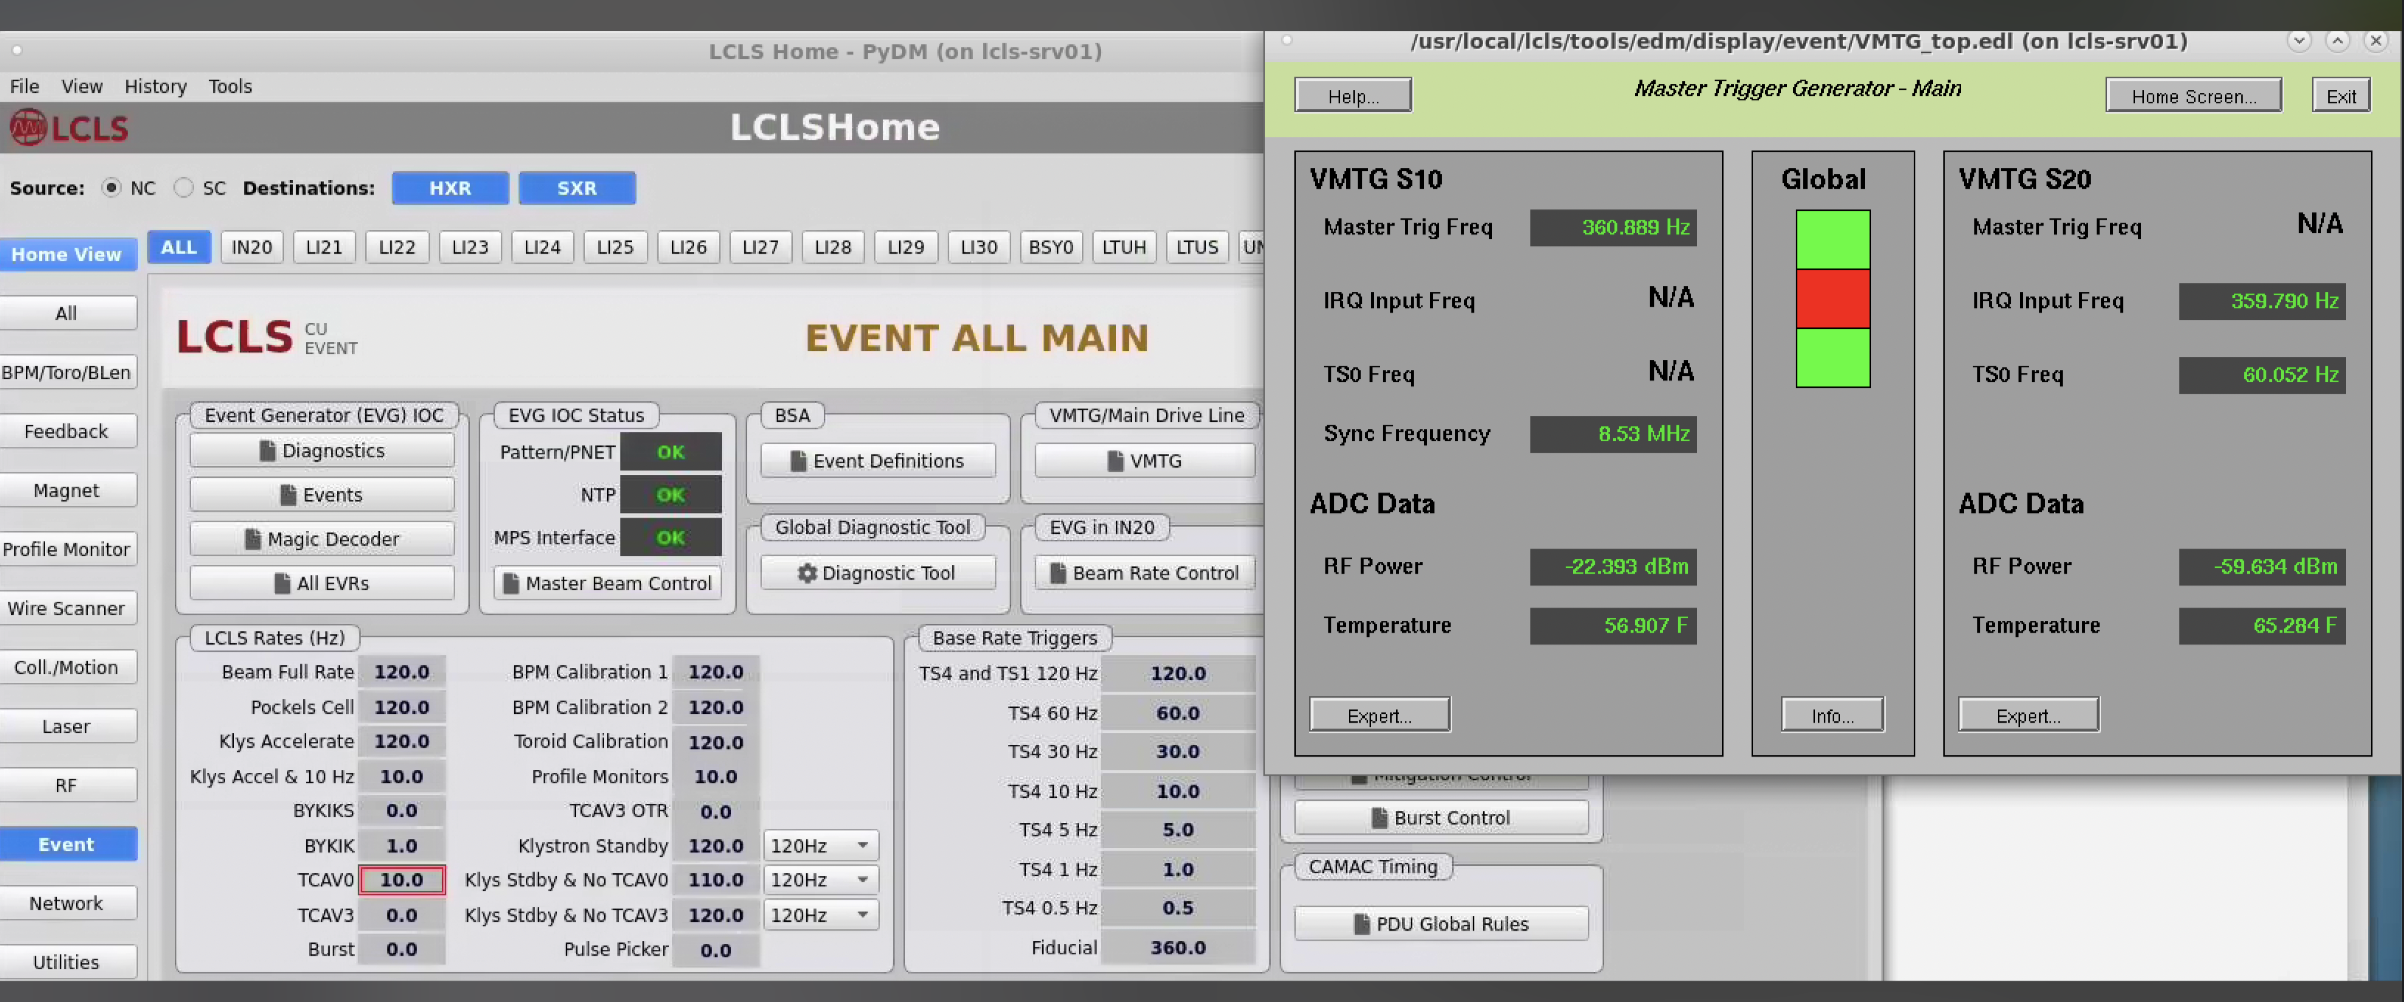
My first clue was in xpmpva at the very bottom of this tab where it says Fiducial Err
That's a check to make sure that the LCLS1 fiducials are arriving on boundaries of 71kHz (any multiple of 1666 - 119 MHz clocks).
LCLS2
This does not apply to LCLS1 timing, I believe.
- Look on main hutch grafana page at upstream-link-status graph
- ssh mcclogin (Ken Brobeck should be contacted to get access, in particular may need access to softegr account).
- ssh softegr@lcls-srv01 (Matt chooses "user 0")
- look at fanouts that are upstream of xpm:0. three layers to get all the way back to the source (the TPG which runs the whole accelerator, has a clock input from master source. clock could conceivably go away). See below for example of this working on rix-daq. Moving upstream:
- caget TPF:LTU0:1:RXLNKUP (immediately upstream)
- caget TPF:IN20:1:RXLNKUP
- caget TPF:GUNB:1:RXLNKUP (fanout that TPG drives)
- caget TPG:SYS0:1:TS (prints out timestamp from TPG, which is a check to see that TPG is running)
- caget TPG:SYS0:1:COUNTBRT (should be 910000 always)
- PERHAPS MORE USEFUL? to determine if problem is on accelerator side: look at the active fanout upstream of xpm0 (in building 5): TPF:LTU0:1:CH14_RXERRCNTS TPF:LTU0:1:FIDCNTDIFF (should be 929kHz) AND TPF:LTU0:1:CH0_PWRLNK.VALB (optical power in to the fanout).
- to see history run "lclshome" on machines like lcls-srv01: exposes archiver on the right hand side (see picture in LCLS1 section above). NOTE: Remember to click "PLOT" in the middle of the right side of the archive viewer. see MCCEpicsArchiverAccess for a video on how to access the MCC epics archiver
Update from Matt on June 4, 2024 that this appears to work now for the hsd kcu's. He supplies this example:
| Code Block |
|---|
(ps-4.6.3) bash-4.2$ pykcu -d /dev/datadev_0 -P DAQ:TSTQ &
[1] 1041
(ps-4.6.3) bash-4.2$ Rogue/pyrogue version v6.1.1. https://github.com/slaclab/rogue
ClkRates:  (0.0, 0.0)
RTT:  ((0, 0), (0, 0), (0, 0), (0, 0))

(ps-4.6.3) bash-4.2$
(ps-4.6.3) bash-4.2$ pvget DAQ:TSTQ:DRP_SRCF_CMP005:MON
DAQ:TSTQ:DRP_SRCF_CMP005:MON 2024-06-03 14:24:10.300
 RxPwr TxBiasI FullTT nFullTT
4.9386   36.16      0       0
0.0233  37.504      0       0
0.0236  38.016      0       0
0.0233  36.224      0       0
and
(ps-4.6.3) bash-4.2$ pykcu -d /dev/datadev_1 -P DAQ:TSTQ &
[1] 1736
(ps-4.6.3) bash-4.2$ Rogue/pyrogue version v6.1.1. https://github.com/slaclab/rogue
ClkRates:  (0.0, 0.0)
RTT:  ((0, 0), (0, 0), (0, 0), (0, 0))

(ps-4.6.3) bash-4.2$ pvget DAQ:TSTQ:DRP_SRCF_CMP005:MON
DAQ:TSTQ:DRP_SRCF_CMP005:MON 2024-06-03 14:27:53.234
 RxPwr TxBiasI FullTT nFullTT
4.1193   36.16      0       0
0.0233   37.44      0       0
0.0235  38.016      0       0
0.0233 36.096 0 0 |
No Phase 2
There have been several instances of not being able to get phase 2 of Configure though an HSD DRP. At least some of these were traced to kcuStatus showing 131 MHz instead of the required 156 MHz. This can happen if the tdetsim service starts instead of kcu.service. Sometimes, no amount of kcuStatus -I or kcuStatus -R restores proper operation. In this case the KCU FPGA may be in a messed up state, so power cycle the node to get the FPGA to reload.
PvaDetector
- If you're seeing std::bad_alloc, see note above in 'datadev Driver' about configuring tdetsim.service
- use "-vvv" to get printout of timestamp matching process
- options to executable: "-1" is fuzzy timestamping, "-0" is no timestamp matching, and no argument is precise timestamp matching.
- the IP where the PV is served might not be the same as the IP returned by a ping. For example: ping ctl-kfe-cam-02 returns 172.21.92.80, but the PV is served at 172.21.156.96
- netconfig can be used to determine the IP where the PV is served. For example:
/reg/common/tools/bin/netconfig search ctl-kfe-cam-02-drp
ctl-kfe-cam-02-drp:
subnet: daq-drp-neh.pcdsn
Ethernet Address: b4:2e:99:ab:14:4f
IP: 172.21.156.96
Contact: uid=velmir,ou=People,dc=reg,o=slac
PC Number: 00000
Location: Same as ctl-kfe-cam-02
Description: DRP interface for ctl-kfe-cam-02
Puppet Classes:Found 1 entries that match ctl-kfe-cam-02-drp.
Fake Camera
- use this to check state of the pgp link, and the readout group, size and link mask (instead of kcuStatus): kcuSim -s -d /dev/datadev_0
- use this to configure readout group, size, link mask: kcuSimValid -d /dev/datadev_0 -c 1 -C 2,320,0xf
- I think this hangs because it's trying to validate a number of events (specified with the -c argument?)
configdb Utility
From Chris Ford. See also ConfigDB and DAQ configdb CLI Notes. Supports ls/cat/cp. NOTE: when copying across hutches it's important to specify the user for the destination hutch. For example:
| Code Block |
|---|
configdb cp --user rixopr --password <usual> --write tmo/BEAM/tmo_atmopal_0 rix/BEAM/atmopal_0 |
Storing (and Updating) Database Records with <det>_config_store.py
Detector records can be defined and then stored in the database using the <det>_config_store.py scripts. For a minimal model see the hrencoder_config_store.py which has just a couple additional entries beyond the defaults (which should be stored for every detector).
Once the record has been defined in the script, the script can be run with a few command-line arguments to store it in the database.
The following call should be appropriate for most use cases.
| Code Block |
|---|
python <det>_config_store.py --name <unique_detector_name> [--segm 0] --inst <hutch> --user <usropr> --password <usual> [--prod] --alias BEAM |
Verify the following:
- User and hutch (
--inst) as defined in the cnf file for the specific configuration and include as--user <usr>. This is used for HTTP authentication. E.g.,tmoopr,tstopr - Password is the standard password used for HTTP authentication.
- Include
--prodif using the production database. This will need to match the entry in yourcnffile as well, defined ascdb.https://pswww.slac.stanford.edu/ws-auth/configdb/wsis the production database. - Do not include the segment number in the detector name. If you are updating an entry for a segment other than 0, pass
–sgem $SEGMin addition to–name $DETNAME
python <det>_config_store.py --help is available and will display all arguments.
There are similar scripts that can be used to update entries. E.g.:
hsd_config_update.py
Making Schema Updates in configdb
i.e. changing the structure of an object while keeping existing values the same. An example from Ric: "Look at the __main__ part of epixm320_config_store.py. Then run it with --update. You don’t need the bit regarding args.dir. That’s for uploading .yml files into the configdb."
Here's an example from Matt: python /cds/home/opr/rixopr/git/lcls2_041224/psdaq/psdaq/configdb/hsd_config_update.py --prod --inst tmo --alias BEAM --name hsd --segm 0 --user tmoopr --password XXXX
MCC Epics Archiver Access
Matt gave us a video tutorial on how to access the MCC epics archiver.
| View file | ||||
|---|---|---|---|---|
|
TEB/MEB
(conversation with Ric on 06/16/20 on TEB grafana page)
BypCt: number bypassing the TEB
BtWtg: boolean saying whether we're waiting to allocate a batch
TxPdg (MEB, TEB, DRP): boolean. libfabric saying try again to send to the designated destination (meb, teb, drp)
RxPdg (MEB, TEB, DRP): same as above but for Rx.
(T(eb)M(eb))CtbOInFlt: incremented on a send, decremented on a receive (hence "in flight")
In tables at the bottom: ToEvtCnt is number of events timed out by teb
WrtCnt MonCnt PsclCnt: the trigger decisions
TOEvtCnt TIEvtCnt: O is outbound from drp to teb, I is inbound from teb to drp
Look in teb log file for timeout messages. To get contributor id look for messages like this in drp:
/reg/neh/home/cpo/2020/06/16_18:19:24_drp-tst-dev010:tmohsd_0.log:Parameters of Contributor ID 8:
Conversation from Ric and Valerio on the opal file-writing problem (11/30/2020):
I was poking around with daqPipes just to familiarize myself with it and I was looking at the crash this morning at around 8.30. I noticed that at 8.25.00 the opal queue is at 100% nd teb0 is starting to give bad signs (again at ID0, from the bit mask) However, if I make steps of 1 second, I see that it seems to recover, with the queue occupancy dropping to 98, 73 then 0. However, a few seconds later the drp batch pool for all the hsd lists are blocked. I would like to ask you (answer when you have time, it is just for me to understand): is this the usual Opal problem that we see? Why does it seem to recover before the batch pool blocks? I see that the first batch pool to be exhausted is the opal one. Is this somehow related?
- I’ve still been trying to understand that one myself, but keep getting interrupted to work on something else, so here is my perhaps half baked thought: Whatever the issue is that blocks the Opal from writing, eventually goes away and so it can drain. The problem is that that is so late that the TEB has started timing out a (many?) partially built event(s). Events for which there is no contributor don’t produce a result for the missing contributor, so if that contributor (sorry, DRP) tried to produce a contribution, it never gets an answer, which is needed to release the input batch and PGP DMA buffer. Then when the system unblocks, a SlowUpdate (perhaps, could be an L1A, too, I think) comes along with a timestamp so far in the future that it wraps around the batch pool, a ring buffer. This blocks because there might already be an older contribution there that is waiting to be released. It scrambles my brain to think about, so apologies if it isn’t clear. I’m trying to think of a more robust way to do it, but haven’t gotten very far yet.
- One possibility might be for the contributor/DRP to time out the input buffer in EbReceiver, so that if a result matching that input never arrives, the input buffer and PGP buffer are released. This could produce some really complicated failure modes that are hard to debug, because the system wouldn’t stop. Chris discouraged me from going down that path for fear of making things more complicated, rightly so, I think.
If a contribution is missing, the *EBs time it out (4 seconds, IIRR), then mark the event with DroppedContribution damage. The Result dgram (TEB only, and it contains the trigger decision) receives this damage and is sent to all contributors that the TEB heard from for that event. Sending it to contributors it didn’t hear from might cause problems because they might have crashed. Thus, if there’s damage raised by the TEB, it appears in all contributions that the DRPs write to disk and send to the monitoring. This is the way you can tell in the TEB Performance grafana plots whether the DRP or the TEB is raising the damage.
Ok thank you. But when you say: "If that contributor (sorry, DRP) tried to produce a contribution, it never gets an answer, which is needed to release the input batch and PGP DMA buffer". I guess you mean that the DRP tries to collect a contribution for a contributor that maybe is not there. But why would the DRP try to do that? It should know about the damage from the TEB's trigger decision, right? (Do not feel compelled to answer immediately, when you have time)
The TEB continues to receive contributions even when there’s an incomplete event in its buffers. Thus, if an event or series of events is incomplete, but a subsequent event does show up as complete, all those earlier incomplete events are marked with DroppedContribution and flushed, with the assumption they will never complete. This happens before the timeout time expires. If the missing contributions then show up anyway (the assumption was wrong), they’re out of time order, and thus dropped on the floor (rather than starting a new event which will have the originally found contributors in it missing (Aaah, my fingers have form knots!), causing a split event (don’t know if that’s universal terminology)). A split event is often indicative of the timeout being too short.
- The problem is that the DRP’s Result thread, what we call EbReceiver, if that thread gets stuck, like in the Opal case, for long enough, it will backpressure into the TEB so that it hangs in trying to send some Result to the DRPs. (I think the half-bakedness of my idea is starting to show…) Meanwhile, the DRPs have continued to produce Input Dgrams and sent them to the TEB, until they ran out of batch buffer pool. That then backs up in the KCU to the point that the Deadtime signal is asserted. Given the different contribution sizes, some DRPs send more Inputs than others, I think. After long enough, the TEB’s timeout timer goes off, but because it’s paralyzed by being stuck in the Result send(), nothing happens (the TEB is single threaded) and the system comes to a halt. At long last, the Opal is released, which allows the TEB to complete sending its ancient Result, but then continues on to deal with all those timed out events. All those timed out events actually had Inputs which now start to flow, but because the Results for those events have already been sent to the contributors that produced their Inputs in time, the DRPs that produced their Inputs late never get to release their Input buffers.
A thought from Ric on how shmem buffer sizes are calculated:
- If the buffer for the Configure dgram (in /usr/lib/systemd/system/tdetsim.service) is specified to be larger, it wins. Otherwise it’s the Pebble buffer size. The Pebble buffer size is derived from the tdetsim.service cfgSize, unless it’s overridden by the pebbleBufSize kwarg to the drp executable
On 4/1/22 there was an unusual crash of the DAQ in SRCF. The system seemed to start up and run normally for a short while (according to grafana plots), but the AMI sources panel didn't fill in. Then many (all?) DRPs crashed (ProcStat Status window) due to not receiving a buffer in which to deposit their SlowUpdate contributions (log files). The ami-node_0 log file shows exceptions '*** Corrupt xtc: namesid 0x501 not found in NamesLookup' and similar messages. The issue was traced to there being 2 MEBs running on the same node. Both used the same 'tag' for the shared memory (the instrument name, 'tst'), which probably led to some internal confusion. Moving one of the MEBs to another node resolved the problem. Giving one of the MEBs a non-default tag (-t option) also solves the problem and allows both MEBs to run on the same node.
Pebble Buffer Count Error
Summary: if you see "One or more DRPs have pebble buffer count > the common RoG's" in the teb log file it means that the common readout group pebble buffers needs to be made the largest either by modifying the .service file or setting the pebbleBufCount kwarg. Note that only one of the detectors in the common RoG needs to have more buffers than the non-common RoG (see example that follows).
More detailed example/explanation from Ric:
case A works (detector with number of pebble buffers):
group0: timing (8192) piran (1M)
group3: bld (1M)
case B breaks:
group0: timing (8192)
group3: bld (1M) piran (1M)
teb needs buffers to put its answers on its own local AND on the drp teb sends back an index to all drp's that is identical even timing allocates space for 1M teb answers (learns through collection that piranha has 1M and also allocates the same)
workaround was to increase dma buffers in tdetsim.service, but this potentially wastes those, really only need pebble buffers which can be individually on the command line of the drp executable with a pebbleBufCount kwarg
note that the teb compares the SUM of tx/rx buffers, which is what the pebble buf count gets set to by default, unless overridden with pebbleBufCount kwarg.
BOS
See Matt's information: Calient S320 ("The BOS")
- Create cross-connections:
curl --cookie PHPSESSID=ue5gks2db6optrkputhhov6ae1 -X POST --header "Content-Type: application/json" --header "Accept: application/json" -d "{\"in\": \"1.1.1\",\"out\": \"6.1.1\",\"dir\": \"bi\",\"band\": \"O\"}" --user admin:pxc*** "http://osw-daq-calients320.pcdsn/rest/crossconnects/?id=add" - Activate cross-connections:
curl --cookie PHPSESSID=ue5gks2db6optrkputhhov6ae1 -X POST --header "Content-Type: application/json" --header "Accept: application/json" --user admin:pxc*** "http://osw-daq-calients320.pcdsn/rest/crossconnects/?id=activate&conn=1.1.1-6.1.1&group=SYSTEM&name=1.1.1-6.1.1"- This doesn't seem to work: Reports '
411 - Length Required'
Use the web GUI for now
- This doesn't seem to work: Reports '
- List cross-connections (easier to read in the web GUI):
curl --cookie PHPSESSID=ue5gks2db6optrkputhhov6ae1 -X GET --user admin:pxc*** 'http://osw-daq-calients320.pcdsn/rest/crossconnects/?id=list' - Save cross-connections to a file:
- Go to http://osw-daq-calients320.pcdsn/
- Navigate to
Ports→Summary - Click on '
Export CSV' in the upper left of the Port Summary table - Check in the resulting file as
lcls2/psdaq/psdaq/cnf/BOS-PortSummary.csv
XPM
Link qualification
Looking at the eye diagram or bathtub curves gives really good image of the high speed links quality on the Rx side. The pyxpm_eyediagram.py tool provides a way to generate these plots for the SFPs while the XPM is receiving real data.
How to use (after loading conda env.)
| Code Block |
|---|
python pyxpm_eyescan.py --ip {XPM_IP_ADDR} --link {AMC_LINK[0:13]} [--hseq {VALUE}] [--eye] [--bathtub] [--gui] [--forceLoopback] [--target {VALUE}] |
Where:
- hseq VALUE: set the high speed equalizer value (see: High-speed repeater configuration below)
- eye: ask for eye diagram generation
- bathtub: ask for the bathtub curve generation
- gui: open debugging view
- forceLoopback: set the link in loopback during the qualification run
High-speed repeater configuration ("equalizer" settings)
High speed repeater, located on the AMC cards, which repeat (clean) the link from/to SFP/FPGA, have to be configured. The equalizer default value does not provide a safe environment and link might not lock with this configuration.
How to use (after loading conda env.). Note that XPM_ID is the usual DAQ ID number (e.g. zero is the supervisor xpm in room 208). This allows Julian's software to talk to the right epics registers:
| Code Block |
|---|
python pyxpm_hsrepeater.py --ip {XPM_IP_ADDR} --xpmid {XPM_ID} --link {AMC_LINK[0:13]} |
What:
- Runs a equalizer scan and reports the link status for each value
- Set a value where no error have been detected in the middle of the working window (the tool does not automatically set the best value)
See results here: Link quality and non-locking issue
An example for XPM 10, AMC 1, Link 3:
| Code Block |
|---|
(ps-4.6.2) claus@drp-neh-ctl002:neh$ python ~/lclsii/daq/lcls2/psdaq/psdaq/pyxpm/pyxpm_hsrepeater.py --ip 10.0.5.102 --xpmid 10 --link 10
Rogue/pyrogue version v5.18.4. https://github.com/slaclab/rogue
Start: Started zmqServer on ports 9103-9105
    To start a gui: python -m pyrogue gui --server='localhost:9103'
    To use a virtual client: client = pyrogue.interfaces.VirtualClient(addr='localhost', port=9103)
Scan equalizer settings for link 10 / XPM 10
    Link[10] status (eq=00): Ready (Rec: 20635200 - Err: 0)
    Link[10] status (eq=01): Ready (Rec: 20635200 - Err: 0)
    Link[10] status (eq=02): Ready (Rec: 20635200 - Err: 0)
    Link[10] status (eq=03): Ready (Rec: 20635201 - Err: 0)
    Link[10] status (eq=07): Ready (Rec: 20635200 - Err: 0)
    Link[10] status (eq=15): Ready (Rec: 20635200 - Err: 0)
    Link[10] status (eq=0B): Ready (Rec: 20635201 - Err: 0)
    Link[10] status (eq=0F): Ready (Rec: 20635200 - Err: 0)
    Link[10] status (eq=55): Ready (Rec: 20635200 - Err: 0)
    Link[10] status (eq=1F): Ready (Rec: 20635200 - Err: 0)
    Link[10] status (eq=2F): Ready (Rec: 20635200 - Err: 0)
    Link[10] status (eq=3F): Ready (Rec: 20635200 - Err: 0)
    Link[10] status (eq=AA): Ready (Rec: 20635200 - Err: 0)
    Link[10] status (eq=7F): Ready (Rec: 20635200 - Err: 0)
    Link[10] status (eq=BF): Ready (Rec: 3155 - Err: 5702)
    Link[10] status (eq=FF): Not ready (Rec: 0 - Err: 9139)
    [Configured] Set eq = 0x00
^CException ignored in: <module 'threading' from '/cds/sw/ds/ana/conda2/inst/envs/ps-4.6.2/lib/python3.9/threading.py'>
Traceback (most recent call last):
  File "/cds/sw/ds/ana/conda2/inst/envs/ps-4.6.2/lib/python3.9/threading.py", line 1477, in _shutdown
    lock.acquire()
KeyboardInterrupt: |
Crate ID is 5 according to the table in Shelf Managers below, and slot is 2 according to the crate photos below. Ctrl-C must be given to terminate the program.
NEH Topology
Before May 2021:
https://docs.google.com/drawings/d/1IX8qFco1tY_HJFdK-UTUKaaP_ZYb3hr3EPJJQS65Ffk/edit?usp=sharing
Now (May 2021):
https://docs.google.com/drawings/d/1clqPlpWZiohWoOaAN9_qr4o06H0OlCHBqAirVo9CXxo/edit?usp=sharing
Eventually:
https://docs.google.com/drawings/d/1alpt4nDkSdIxZRQdHMLxyvG5HsCrc7kImiwGUYAPHSE/edit?usp=sharing
XPM topology after recabling for SRCF (May 10, 2023):
| Code Block |
|---|
globalTiming -> newxpm0 -> 2 (tmo) -> 4 (tmo)
|
| Code Block |
(ps-4.5.26) rix-daq:scripts> caget TPF:GUNB:1:RXLNKUP TPF:GUNB:1:RXLNKUP 1 (ps-4.5.26) rix-daq:scripts> caget TPF:IN20:1:RXLNKUP TPF:IN20:1:RXLNKUP -> 6 (208) -> BOS -> 3 1 (ps-4.5.26) rix-daq:scripts> caget TPF:LTU0:1:RXLNKUP TPF:LTU0:1:RXLNKUPrix) -> 5 (208) -> BOS 1 (ps-4.5.26) rix-daq:scripts> caget TPG:SYS0:1:COUNTBRT TPG:SYS0:1:COUNTBRT -> 1 910000(rix) (ps-4.5.26XPM0 (208) rix-daq:scripts> |
Can also look for errors from lclshome: select "SC" (top left) "Global" (left of top row) and "Event" (middle of left column) then "Expert Display" on upper right:
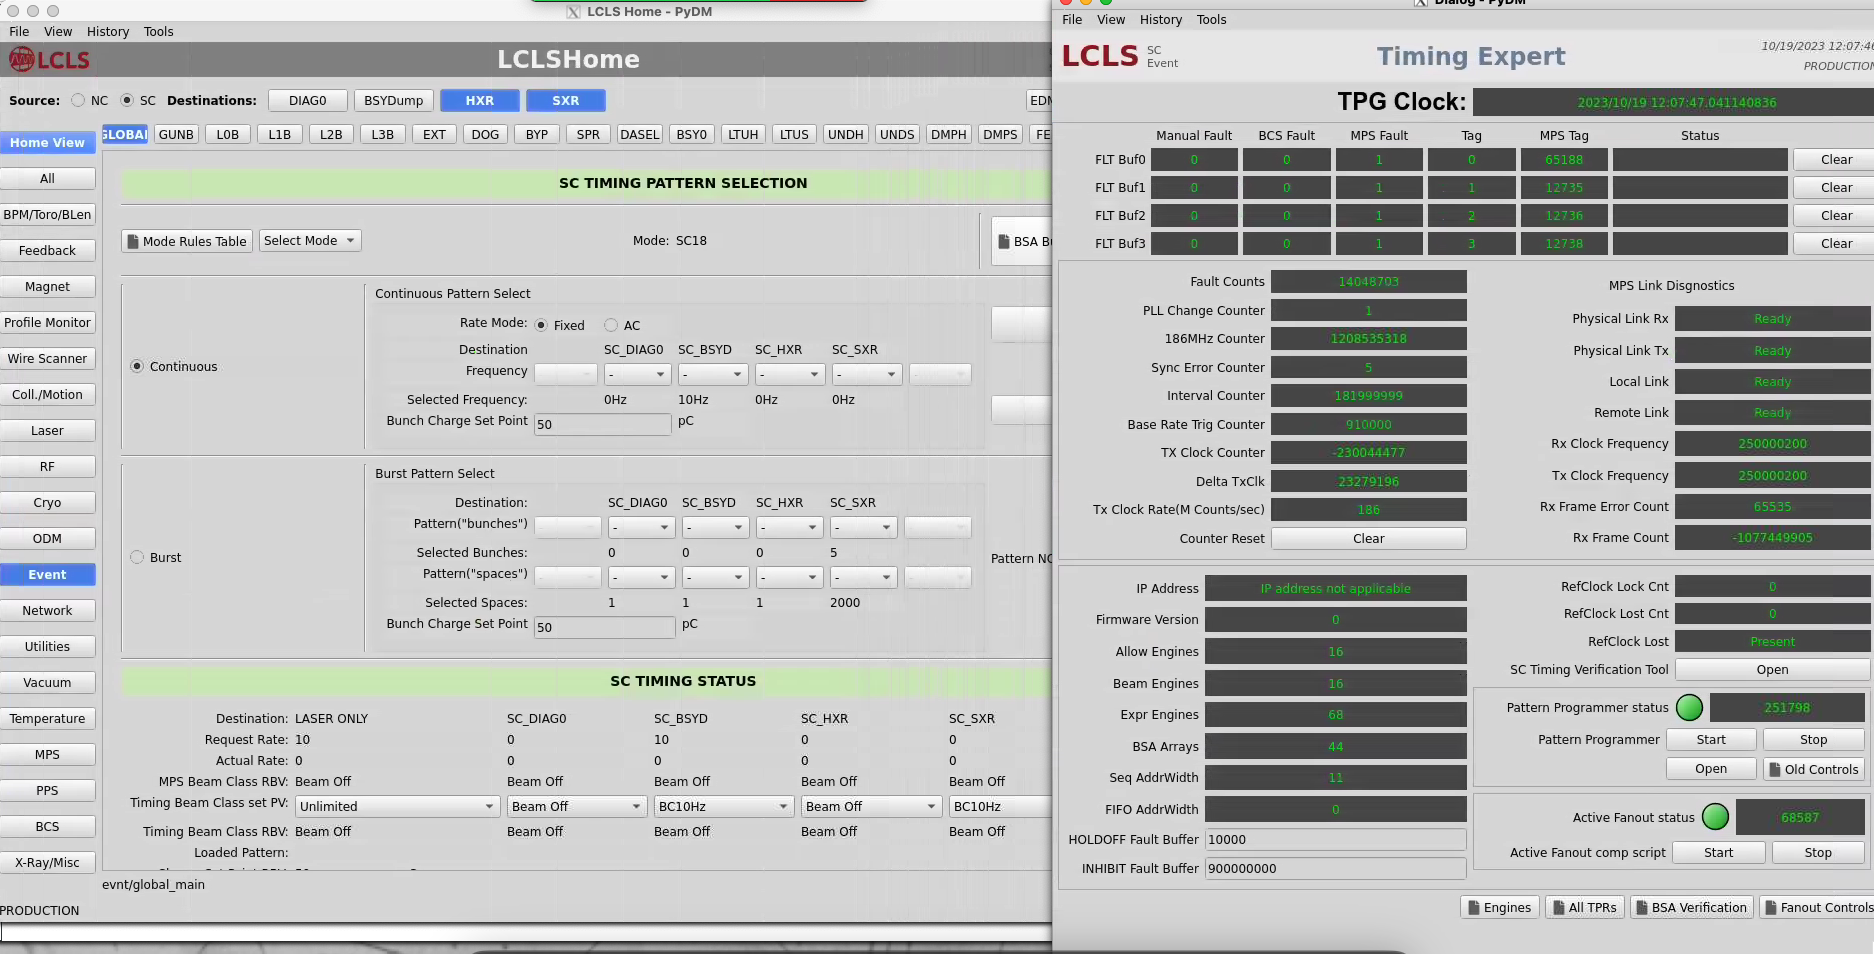
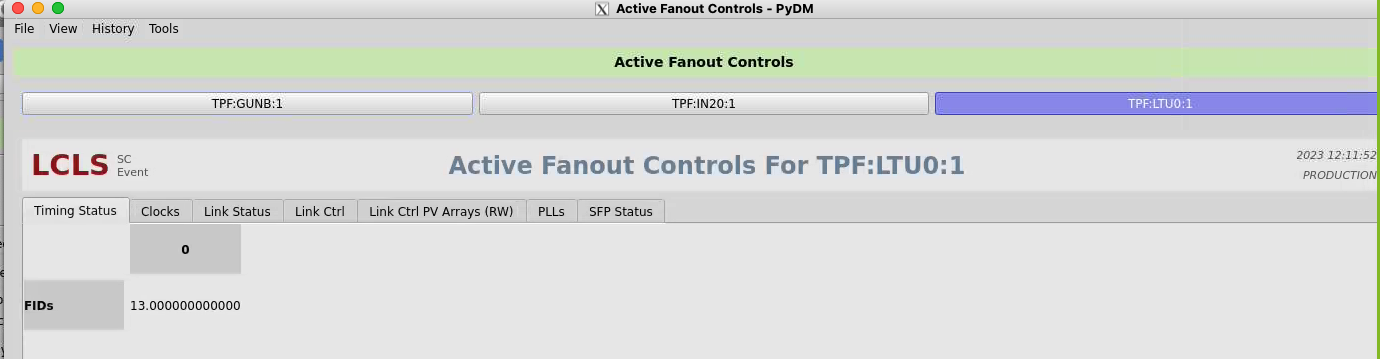
Click on "fanout controls" in lower right. Select "TPF:LTU0:1", on the "Timing Status" tab expect to see 929kHz of "fiducials". This shows an error condition:
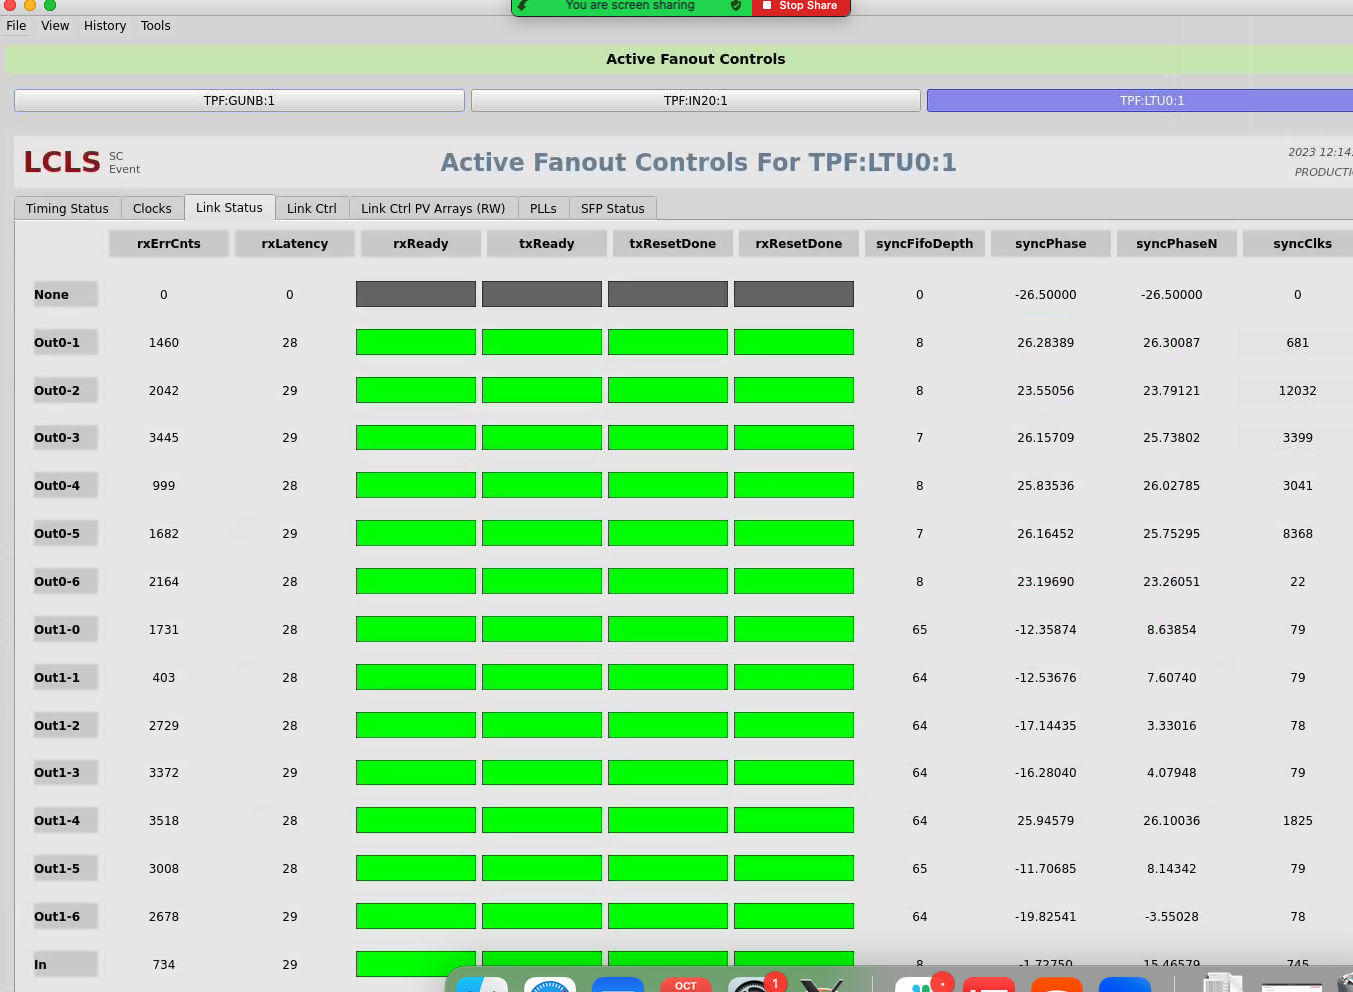
The "Link Status" tab rxErrCnts value should be zero (especially for the "In" at the bottom line). This shows an error condition.
-> 10 (fee) -> 11(fee) |
NEH Connections
From xpmpva on Oct. 31, 2022.
Numbering
amc1 on left, amc0 on right
ports count 0-6 from right to left, matching labelling on xpm, but opposite the order in xpmpva which goes left to right
LEFTMOST PORT IS UNUSED (labelled 7 on panel)
in fee, xpm0 was lowest slot (above switch), xpm1 one up
pyxpm 2 is fee (currently the master), 4 is hutch, 3 unused
epics numbering of xpm 0 2 1
IP Addresses
From Matt: The ATCA crate in the FEE has a crate number that must differ from the other crates on the network. That crate number comes from the shelf manager. So, when we get a shelf manager, we'll need to set its crate ID. That determines the third byte for all the IP addresses in the crate. 10.0.<crate>.<slot+100>. See LCLS-II: Generic IPMC Commands#HowtosetupATCAcrateID for setting the ATCA crate ID.
An example session from Matt:
| Code Block |
|---|
[weaver@psdev02 ~]$ ssh root@shm-neh-daq02
key_load_public: invalid format
Warning: Permanently added 'shm-neh-daq02,172.21.156.127' (RSA) to the list of known hosts.
root@shm-neh-daq02's password:
sh: /usr/bin/X11/xauth: not found
# clia shelfaddress
Pigeon Point Shelf Manager Command Line Interpreter
Shelf Address Info: "L2SI_0002" |
Timing Link Glitches
LCLS1
Timing Missing
Matt writes that he logs in lcls-srv01 (see below) and launches "lclshome" to see that the LCLS1 timing is down. If you see an "xcb" error it means X-forwarding is broken, perhaps because of a bad key in .ssh/known_hosts.
Matt says to look at the "Event" row:
Timing Not Down-Sampled Correctly
Debugging with Matt on March 12, 2024
Matt says you can see this with epics on lcls-srv01:
| Code Block |
|---|
[softegr@lcls-srv01 ~ ]$ caget IOC:GBL0:EV02:SyncFRQMHZ
IOC:GBL0:EV02:SyncFRQMHZ 8.44444 |
Here's a screen shot from LCLS home that shows it. I'm just looking at it for the first time. Where it says 8.53 MHz should be 71 kHz.
My first clue was in xpmpva at the very bottom of this tab where it says Fiducial Err
That's a check to make sure that the LCLS1 fiducials are arriving on boundaries of 71kHz (any multiple of 1666 - 119 MHz clocks).
LCLS2
Upstream Timing Issues
This does not apply to LCLS1 timing, I believe.
- Look on main hutch grafana page at upstream-link-status graph
- ssh mcclogin (Ken Brobeck should be contacted to get access, in particular may need access to softegr account).
- ssh softegr@lcls-srv01 (Matt chooses "user 0")
- look at fanouts that are upstream of xpm:0. three layers to get all the way back to the source (the TPG which runs the whole accelerator, has a clock input from master source. clock could conceivably go away). See below for example of this working on rix-daq. Moving upstream:
- caget TPF:LTU0:1:RXLNKUP (immediately upstream)
- caget TPF:IN20:1:RXLNKUP
- caget TPF:GUNB:1:RXLNKUP (fanout that TPG drives)
- caget TPG:SYS0:1:TS (prints out timestamp from TPG, which is a check to see that TPG is running)
- caget TPG:SYS0:1:COUNTBRT (should be 910000 always)
- PERHAPS MORE USEFUL? to determine if problem is on accelerator side: look at the active fanout upstream of xpm0 (in building 5): TPF:LTU0:1:CH14_RXERRCNTS TPF:LTU0:1:FIDCNTDIFF (should be 929kHz) AND TPF:LTU0:1:CH0_PWRLNK.VALB (optical power in to the fanout).
- to see history run "lclshome" on machines like lcls-srv01: exposes archiver on the right hand side (see picture in LCLS1 section above). NOTE: Remember to click "PLOT" in the middle of the right side of the archive viewer. see MCCEpicsArchiverAccess for a video on how to access the MCC epics archiver
| Code Block |
|---|
(ps-4.5.26) rix-daq:scripts> caget TPF:GUNB:1:RXLNKUP
TPF:GUNB:1:RXLNKUP             1
(ps-4.5.26) rix-daq:scripts> caget TPF:IN20:1:RXLNKUP
TPF:IN20:1:RXLNKUP             1
(ps-4.5.26) rix-daq:scripts> caget TPF:LTU0:1:RXLNKUP
TPF:LTU0:1:RXLNKUP             1
(ps-4.5.26) rix-daq:scripts> caget TPG:SYS0:1:COUNTBRT
TPG:SYS0:1:COUNTBRT            910000
(ps-4.5.26) rix-daq:scripts> |
Can also look for errors from lclshome: select "SC" (top left) "Global" (left of top row) and "Event" (middle of left column) then "Expert Display" on upper right:
Click on "fanout controls" in lower right. Select "TPF:LTU0:1", on the "Timing Status" tab expect to see 929kHz of "fiducials". This shows an error condition:
The "Link Status" tab rxErrCnts value should be zero (especially for the "In" at the bottom line). This shows an error condition.
One of these "outs" goes to a local fanout in 208, which then drives xpm0.
Triggers/Transitions Behaving Erratically
Saw this after an ACR timing system outage on May 22, 2024.
Transitions weren't transmitted from xpm3. Fixed-rate L1Accepts seemed to go in bursts. Dumped out xpm3 frames to log file with xpmpva. Saw that the readout group messages were stuck. Fixed with a TxLinkReset to xpm3 (from xpm0). May have also been fixed with an RxLinkReset in the xpmpva UsTiming tab of xpm3.
Decoding XPM Packets
to dump xpm frames to log file, put unused link in loopback and click "rxlinkdump" in xpmpva. this appears to dump 4 of the MHz frames to the pyxpm log file. when looking at xpm msg output it is important to run at 929kHz trigger rate so that things change (otherwise one ends up looking at identical frames). The values here refer to the dump below
b5bc are idle characters
b53c is start of frame
b5f7 may be start of segment or maybe not?
0080 byteswapped is 8000 which is segment 0
first segment is accelerator segment and second is the xpm-addition, e.g. readout groups)
the second segment begins at b51c (might be end of segment)
second segment begins with 1080 (actually 8001 byte-swapped) which is segment 1
next 32 bits it broadcast of partition delays, 4c is the group2 L0Delay
e200: e is a special character, and 2 means this delay is for group2. cycle through 8 groups over 8 929MHz packets and then then on the ninth frame comes the remoteid (in the same 32 bits)
f038 1d9c 0010 is the xpm message for readout group 0
8000 0000 0000 is same for rog1
48 bits: transition id, l1 counter, other tag bits
d72b b055 0017 is same for rog2
in the next frame this is rog2
d72b b055 0017
this is incorrect, since identical to previous frame (L1 counter should increment)
format of the accelerator "segment0" is:
0080 0001 (segment id, and version number)
7d5e 73f3 8d82 0000 (pulseid)
ff7c 18fc d224 40af (timestamp)
0040 (rate markers, e.g. bit 6 is MHz, bit 5 is 71kHz etc.)
0c93 (encodes timeslot and frames since last timeslot, 6 timeslots that increment at 360Hz)
can see the accelerator pulseid incrementing by 1 on each frame (after byte swap):
7d5e 73f3 8d82
7d5f 73f3 8d82
7d60 73f3 8d82
7d61 73f3 8d82
b5bc b5bc b5bc b5bc b5bc b5bc b5bc b5bc b5bc b5bc b5bc b5bc b5bc b5bc b5bc
b5bc b5bc b5bc b5bc b5bc b5bc b5bc b5bc b5bc b5bc b5bc b5bc b5bc b5bc b5bc b5bc
b5bc b5bc b5bc b5bc b5bc b5bc b5bc b5bc b5bc b5bc b5bc b5bc b5bc b5bc b5bc b5bc
b5bc b5bc b5bc b5bc b5bc b5bc b5bc b5bc b5bc b5bc b5bc b5bc b5bc b5bc b5bc b5bc
b5bc b5bc b5bc b5bc b5bc b5bc b5bc b5bc b5bc b5bc b53c b5f7 0080 0001 7d5e 73f3
8d82 0000 ff7c 18fc d224 40af 0040 0c93 0000 0000 0000 0000 0000 0000 0000 0000
4000 0000 0000 0000 0000 0000 0000 0000 0000 0000 0000 0000 0000 0000 0000 0000
0000 0000 0000 0000 0000 0000 0000 0000 0000 0000 0000 0000 0000 0000 0000 0000
0000 0000 0000 0000 0000 0000 0080 0000 b51c 1080 004c e200 f038 1d9c 0010 8000
0000 0000 d72b b055 0017 8000 0000 0000 8000 0000 0000 8804 0002 0000 8000 0000
0000 8000 0000 0000 b51c b5fd 78ec 7689 b5bc b5bc b5bc b5bc b5bc b5bc b5bc b5bc
b5bc b5bc b5bc b5bc b5bc b5bc b5bc b5bc b5bc b5bc b5bc b5bc b5bc b5bc b5bc b5bc
b5bc b5bc b5bc b5bc b5bc b5bc b5bc b5bc b5bc b5bc b5bc b5bc b5bc b5bc b5bc b5bc
b5bc b5bc b5bc b5bc b5bc b5bc b5bc b5bc b5bc b5bc b5bc b5bc b5bc b5bc b5bc b5bc
b5bc b5bc b5bc b5bc b5bc b5bc b5bc b5bc b5bc b5bc b5bc b5bc b5bc b5bc b5bc b5bc
b5bc b5bc b5bc b5bc b5bc b5bc b5bc b5bc b5bc b5bc b5bc b5bc b5bc b5bc b5bc b5bc
b5bc b5bc b5bc b5bc b5bc b5bc b5bc b5bc b5bc b5bc b5bc b5bc b5bc b5bc b5bc b5bc
b5bc b5bc b53c b5f7 0080 0001 7d5f 73f3 8d82 0000 03b1 18fd d224 40af 0060 0c9b
0000 0000 0000 0000 0000 0000 0000 0000 4000 0000 0000 0000 0000 0000 0000 0000
0000 0000 0000 0000 0000 0000 0000 0000 0000 0000 0000 0000 0000 0000 0000 0000
0000 0000 0000 0000 0000 0000 0000 0000 0000 0000 0000 0000 0000 0000 0080 0000
b51c 1080 0051 e300 f038 1d9c 0010 8000 0000 0000 d72b b055 0017 8000 0000 0000
8000 0000 0000 8804 0002 0000 8000 0000 0000 8000 0000 0000 b51c b5fd e3eb 5435
b5bc b5bc b5bc b5bc b5bc b5bc b5bc b5bc b5bc b5bc b5bc b5bc b5bc b5bc b5bc b5bc
b5bc b5bc b5bc b5bc b5bc b5bc b5bc b5bc b5bc b5bc b5bc b5bc b5bc b5bc b5bc b5bc
b5bc b5bc b5bc b5bc b5bc b5bc b5bc b5bc b5bc b5bc b5bc b5bc b5bc b5bc b5bc b5bc
b5bc b5bc b5bc b5bc b5bc b5bc b5bc b5bc b5bc b5bc b5bc b5bc b5bc b5bc b5bc b5bc
b5bc b5bc b5bc b5bc b5bc b5bc b5bc b5bc b5bc b5bc b5bc b5bc b5bc b5bc b5bc b5bc
b5bc b5bc b5bc b5bc b5bc b5bc b5bc b5bc b5bc b5bc b5bc b5bc b5bc b5bc b5bc b5bc
b5bc b5bc b5bc b5bc b5bc b5bc b5bc b5bc b5bc b5bc b53c b5f7 0080 0001 7d60 73f3
8d82 0000 07e6 18fd d224 40af 0040 0ca3 0000 0000 0000 0000 0000 0000 0000 0000
4000 0000 0000 0000 0000 0000 0000 0000 0000 0000 0000 0000 0000 0000 0000 0000
0000 0000 0000 0000 0000 0000 0000 0000 0000 0000 0000 0000 0000 0000 0000 0000
0000 0000 0000 0000 0000 0000 0080 0000 b51c 1080 0064 e400 f038 1d9c 0010 8000
0000 0000 d72b b055 0017 8000 0000 0000 8000 0000 0000 8804 0002 0000 8000 0000
0000 8000 0000 0000 b51c b5fd 6817 792a b5bc b5bc b5bc b5bc b5bc b5bc b5bc b5bc
b5bc b5bc b5bc b5bc b5bc b5bc b5bc b5bc b5bc b5bc b5bc b5bc b5bc b5bc b5bc b5bc
b5bc b5bc b5bc b5bc b5bc b5bc b5bc b5bc b5bc b5bc b5bc b5bc b5bc b5bc b5bc b5bc
b5bc b5bc b5bc b5bc b5bc b5bc b5bc b5bc b5bc b5bc b5bc b5bc b5bc b5bc b5bc b5bc
b5bc b5bc b5bc b5bc b5bc b5bc b5bc b5bc b5bc b5bc b5bc b5bc b5bc b5bc b5bc b5bc
b5bc b5bc b5bc b5bc b5bc b5bc b5bc b5bc b5bc b5bc b5bc b5bc b5bc b5bc b5bc b5bc
b5bc b5bc b5bc b5bc b5bc b5bc b5bc b5bc b5bc b5bc b5bc b5bc b5bc b5bc b5bc b5bc
b5bc b5bc b53c b5f7 0080 0001 7d61 73f3 8d82 0000 0c1b 18fd d224 40af 0040 0cab
0000 0000 0000 0000 0000 0000 0000 0000 4000 0000 0000 0000 0000 0000 0000 0000
0000 0000 0000 0000 0000 0000 0000 0000 0000 0000 0000 0000 0000 0000 0000 0000
0000 0000 0000 0000 0000 0000 0000 0000 0000 0000 0000 0000 0000 0000 0080 0000
b51c 1080 0001 e500 f038 1d9c 0010 8000 0000 0000 d72b b055 0017 8000 0000 0000
8000 0000 0000 8804 0002 0000 8000 0000 0000 8000 0000 0000 b51c b5fd 698f 664c
b5bc b5bc b5bc b5bc b5bc b5bc b5bc b5bc b5bc b5bc b5bc b5bc b5bc b5bc b5bc b5bc
b5bc b5bc b5bc b5bc b5bc b5bc b5bc b5bc b5bc b5bc b5bc b5bc b5bc b5bc b5bc b5bc
b5bc b5bc b5bc b5bc b5bc b5bc b5bc b5bc b5bc b5bc b5bc b5bc b5bc b5bc b5bc b5bc
b5bc b5bc b5bc b5bc b5bc b5bc b5bc b5bc b5bc b5bc b5bc b5bc b5bc b5bc b5bc b5bc
b5bc b5bc b5bc b5bc b5bc b5bc b5bc b5bc b5bc b5bc b5bc b5bc b5bc b5bc b5bc b5bc
b5bc b5bc b5bc b5bc b5bc b5bc b5bc b5bc b5bc b5bc b5bc b5bc b5bc b5bc b5bc b5bc
b5bc b5bc b5bc b5bc b5bc b5bc b5bc b5bc b5bc b5bc b53c b5f7 0080 0001 7d62 73f3
8d82 0000 1050 18fd d224 40af 0040 0cb3 0000 0000 0000 0000 0000 0000 0000 0000
4000 0000 0000 0000 0000 0000 0000 0000 0000 0000 0000 0000 0000 0000 0000 0000
0000 0000 0000 0000 0000 0000 0000 0000 0000 0000 0000 0000 0000 0000 0000 0000
0000 0000 0000 0000 0000 0000 0080 0000 b51c 1080 0001 e600 f038 1d9c 0010 8000
0000 0000 d72b b055 0017 8000 0000 0000 8000 0000 0000 8804 0002 0000 8000 0000
0000 8000 0000 0000 b51c b5fd fb1f 31be b5bc b5bc b5bc b5bc b5bc b5bc b5bc b5bc
b5bc b5bc b5bc b5bc b5bc b5bc b5bc b5bc b5bc b5bc b5bc b5bc b5bc b5bc b5bc b5bc
b5bc b5bc b5bc b5bc b5bc b5bc b5bc b5bc b5bc b5bc b5bc b5bc b5bc b5bc b5bc b5bc
b5bc b5bc b5bc b5bc b5bc b5bc b5bc b5bc b5bc b5bc b5bc b5bc b5bc b5bc b5bc One of these "outs" goes to a local fanout in 208, which then drives xpm0.
Trigger Delays
See also Matt's timing diagram on this page: Bypass Events
...
Larry thinks that these are in the raw units read out from the device (mW) and says that to convert to dBm use the following formula: 10*log(10)(val/1mW). For example, 0.6 corresponds to -2.2dBm. The same information is now displayed with xpmpva in the "SFPs" tab.
| Code Block |
|---|
(ps-4.1.2) tmo-daq:scripts> pvget DAQ:NEH:XPM:0:SFPSTATUS
DAQ:NEH:XPM:0:SFPSTATUS 2021-01-13 14:36:15.450
LossOfSignal ModuleAbsent TxPower RxPower
           0            0  6.5535  6.5535
           1            0  0.5701  0.0001
           0            0  0.5883  0.7572
           0            0  0.5746  0.5679
           0            0  0.8134   0.738
           0            0  0.6844    0.88
           0            0  0.5942  0.4925
           0            0  0.5218  0.7779
           1            0   0.608  0.0001
           0            0  0.5419  0.3033
           1            0  0.6652  0.0001
           0            0  0.5177  0.8751
           1            1       0       0
0 0 0.7723 0.201 |
Programming Firmware
From Matt. He says the current production version (which still suffers from xpm-link-glitch storms) is 0x030504. The git repo with firmware is here:
https://github.com/slaclab/l2si-xpm
Please remember to stop the pyxpm process associated with the xpm before proceeding.
Connect to tmo-daq as tmoopr and use procmgr stop neh_-base.cnf pyxpm-xx.
| Code Block |
|---|
ssh drp-neh-ctl01. (with ethernet access to ATCA switch: or drp-srcf-mon001 for production hutches) ~weaver/FirmwareLoader/rhel6/FirmwareLoader -a <XPM_IPADDR> <MCS_FILE>. (binary copied from afs) ssh psdev source /cds/sw/package/IPMC/env.sh fru_deactivate shm-fee-daq01/<SLOT> fru_activate shm-fee-daq01/<SLOT> The MCS_FILE can be found at: /cds/home/w/weaver/mcs/xpm/xpm-0x03060000-20231009210826-weaver-a0031eb.mcs /cds/home/w/weaver/mcs/xpm/xpm_noRTM-0x03060000-20231010072209-weaver-a0031eb.mcs |
Incorrect Fiducial Rates
In Jan. 2023 Matt saw a failure mode where xpmpva showed 2kHz fiducial rate instead of the expected 930kHz. This was traced to an upstream accelerator timing distribution module being uninitialized.
In April 2023, DAQs run on SRCF machines had 'PGPReader: Jump in complete l1Count' errors. Matt found XPM:0 receiving 929kHz of fiducials but only transmitting 22.5kHz, which he thought was due to CRC errors on its input. Also XPM:0's FbClk seemed frozen. Matt said:
I could see the outbound fiducials were 22.5kHz by clicking one of the outbound ports LinkLoopback on. The received rate on that outbound link is then the outbound fiducial rate.
At least now we know this error state is somewhere within the XPM and not upstream.
The issue was cleared up by resetting XPM:0 with fru_deactivate/activate to clear up a bad state.
Note that when the XPMs are in a good state, the following values should be seen:
- Global tab:
- RecClk: 185 MHz
- FbClk: 185 MHz
- UsTiming tab:
- RxClks: 185 MHz
- RxLinkUp: 1
- CrcErrs: 0
- RxDecErrs: 0
- RxDspErrs: 0
- FIDs: 929 kHz
- SOFs: 929 kHz
- EOFs: 929 kHz
No RxRcv/RxErr Frames in xpmpva
If RxRcv/RxErr frames are stuck in xpmpva it may be that the network interface to the ATCA crate is not set up for jumbo frames.
Link Issues
If XPM links don't lock, here are some past causes:
- check that transceivers (especially QSFP, which can be difficult) are fully plugged in.
- for opal detectors:
- use devGui to toggle between xpmmini/LCLS2 timing (Matt has added this to the opal config script, but to the part that executes at startup time)
- hit TxPhyReset in the devGui (this is now done in the opal drp executable)
- if timing frames are stuck in a camlink node hitting TxPhyPllReset started the timing frame counters going (and it lighter-weight than xpmmini→lcls2 timing toggle)
- on a TDet node found "kcusim -T" (reset timing PLL) made a link lock
- for timing system detectors: run "kcuSim -s -d /dev/datadev_1", this should also be done when one runs a drp process on the drp node (to initialize the timing registers). the drp executable in this case doesn't need any transitions.
- hit Tx/Rx reset on xpmpva gui (AMC tabs).
- use loopback fibers (or click a loopback checkbox in xpmpva) to determine which side has the problem
- try swapping fibers in the BOS to see if the problem is on the xpm side or the kcu side
- we saw once where we have to power cycle a camlink drp node to make the xpm timing link lock. Matt suggests that perhaps hitting PLL resets in the rogue gui could be a more delicate way of doing this.
- (old information with the old/broken BOS) Valerio and Matt had noticed that the BOS sometimes lets its connections deteriorate. To fix:
- ssh root@osw-daq-calients320
- omm-ctrl --reset
Timing Frames Not Properly Received
- do TXreset on appropriate port
- toggling between xpmmini and lcls2 timing can fix (we have put this in the code now, previously was lcls1-to-lcls2 timing toggle in the code)
- sometimes xpm's have become confused and think they are receiving 26MHz timing frames when they should be 0.9MHz (this can be seen in the upstream-timing tab of xpmpva ("UsTiming"). you can determine which xpm is responsible by putting each link in loopback mode: if it is working properly you should see 0.9MHz of rx frames in loopback mode (normally 20MHz of frames in normal mode). Proceed upstream until you find a working xpm, then do tx resets (and rx?) downstream to fix them,
Network Connection Difficulty
Saw this error on Nov. 2 2021 in lab3 over and over:
| Code Block |
|---|
WARNING:pyrogue.Device.UdpRssiPack.rudpReg:host=10.0.2.102, port=8193 -> Establishing link ... |
Matt writes:
That error could mean that some other pyxpm process is connected to it. Using ping should show if the device is really off the network, which seems to be the case. You can also use "amcc_dump_bsi --all shm-tst-lab2-atca02" to see the status of the ATCA boards from the shelf manager's view. (source /afs/slac/g/reseng/IPMC/env.sh[csh] or source /cds/sw/package/IPMC/env.sh[csh]) It looks like the boards in slots 2 and 4 had lost ethernet connectivity (with the ATCA switch) but should be good now. None of the boards respond to ping, so I'm guessing its the ATCA switch that's failed. The power on that board can also be cycled with "fru_deactivate, fru_activate". I did that, and now they all respond to ping.
Firmware Varieties and Switching Between Internal/External Timing
NOTE: these instructions only apply for XPM boards running "xtpg" firmware. This is the only version that supports internal timing for the official XPM boards. It has a software-selectable internal/external timing using the "CuInput" variable. KCU1500's running the xpm firmware have a different image for internal timing with "Gen" in the name (see /cds/home/w/weaver/mcs/xpm/*Gen*, which currently contains only a KCU1500 internal-timing version).
If the xpm board is in external mode in the database we believe we have to reinitialize the database by running:
python pyxpm_db.py --inst tmo --name DAQ:NEH:XPM:10 --prod --user tmoopr --password pcds --alias XPM
CuInput flag (DAQ:NEH:XPM:0:XTPG:CuInput) is set to 1 (for internal timing) instead of 0 (external timing with first RTM SFP input, presumably labelled "EVR[0]" on the RTM, but we are not certain) or 3 (second RTM SFP timing input labelled "EVR[1]" on the RTM).
Matt says there are three types of XPM firmware: (1) an XTPG version which requires an RTM input (2) a standard XPM version which requires RTM input (3) a version which gets its timing input from AMC0 port 0 (with "noRTM" in the name). The xtpg version can take lcls1 input timing and convert to lcls2 or can generate internal lcls2 timing. Now that we have switched the tmo/rix systems to lcls2 timing this version is not needed anymore: the "xpm" firmware version should be used. The one exception is the detector group running in MFX from LCLS1 timing which currently uses xpm7 running xtpg firmware.
This file puts xpm-0 in internal timing mode: https://github.com/slac-lcls/lcls2/blob/master/psdaq/psdaq/cnf/internal-neh-base.cnf. Note that in internal timing mode the L0Delay (per-readout-group) seems to default to 90. Fix it with pvput DAQ:NEH:XPM:0:PART:0:L0Delay 80".
One should switch back to external mode by setting CuInput to 0 in xpmpva CuTiming tab. Still want to switch to external-timing cnf file after this is done. Check that the FiducialErr box is not checked (try ClearErr to see if it fixes). If this doesn't clear it can be a sign that ACR has put it "wrong divisor" on their end.
...
- python scripts/wave8DAQ.py --start_viewer 1 --l 2 (for the front-end board)
- Use this to toggle between XpmMini and LCLS2 timing (maybe with --start_viewer 0)
- python scripts/wave8DAQ.py --l 3 --enDataPath 0 --startupMode 1 (run devGui at the same time as the daq)
- As of 2024-06-06 (at least) you can run the Kcu1500 devGui with rogue6 in ps-4.6.3
Code Block python scripts/PgpMonitor.py --numLane 8 --boardType XilinxKcu1500
(new way of running kcu1500 gui from the pgp-pcie-apps/ repo, currently needs rogue5 in ps-4.6.1) python scripts/PgpMonitor.py --numLane 8 --boardType XilinxKcu1500- (OLD way of running kcu1500 gui) python scripts/PcieDebugGui.py --boardType Kcu1500 (need the flag at the end to get qsfp optical powers)
...
I was having this problem as well. I think it may have something to do with dmypy processes that hang around. If one can get this guy to restart, the problem goes away. For me, there were a bunch:
(ps-4.5.16) claus@drp-neh-ctl001:srcf$ ps -ef | grep dmypy
claus 61073 1 0 Jan07 ? 00:00:05 /cds/sw/ds/ana/conda2/inst/envs/ps-4.5.5/bin/python /cds/sw/ds/ana/conda2/inst/envs/ps-4.5.5/bin dmypy start
claus 61608 1 0 Apr01 ? 00:00:04 /cds/sw/ds/ana/conda2/inst/envs/ps-4.5.11/bin/python /cds/sw/ds/ana/conda2/inst/envs/ps-4.5.11/bin/dmypy start
claus 285627 222348 0 19:32 pts/9 00:00:00 grep dmypy
claus 353768 1 0 Jun09 ? 00:00:59 /cds/sw/ds/ana/conda2/inst/envs/ps-4.5.13/bin/python /cds/sw/ds/ana/conda2/inst/envs/ps-4.5.13/bin/dmypy start
claus 360001 1 0 Jun09 ? 00:01:02 /cds/sw/ds/ana/conda2/inst/envs/ps-4.5.13/bin/python /cds/sw/ds/ana/conda2/inst/envs/ps-4.5.13/bin/dmypy start
I tried running ami-client on a different machine, which didn’t have an issue. It also printed 'Daemon started’ whereas on the usual machine I run it on it printed 'Daemon is still alive’. When I switched back to running on the usual machine, a new daemon was started and ami-client ran cleanly.
I found on https://mypy.readthedocs.io/en/stable/mypy_daemon.html that there is a ‘dmypy stop’ command, but it doesn’t seem to stop the existing daemons, so I killed ‘em.
Controlling GMD and XGMD
to see gui's to control lcls2-timing trigger inputs:
ssh kfe-console
$ cd /cds/group/pcds/epics/ioc/kfe/gmd/R3.1.0/gmdScreens
$ ./launch_gmd_main_pcds.sh
$ ./launch_xgmd_main_pcds.sh
or go to lcls-srv01 and run "lclshome"
for lcls1-timing (outdated) can find it in "kfe" gmd/xgmd tabs and goto
waveforms and then "timing" button.
To control the BLD rate: (from Marcio)
Press the Acq. Services on the main screen. Then click on the BLD tab. Then Rate Control. And, finally, on th
e BLD1 row, click on the button with a “…”.
Make sure to hit "enter" as each field is changed (will be "purple"
until enter is hit).
00:01:02 /cds/sw/ds/ana/conda2/inst/envs/ps-4.5.13/bin/python /cds/sw/ds/ana/conda2/inst/envs/ps-4.5.13/bin/dmypy start
I tried running ami-client on a different machine, which didn’t have an issue. It also printed 'Daemon started’ whereas on the usual machine I run it on it printed 'Daemon is still alive’. When I switched back to running on the usual machine, a new daemon was started and ami-client ran cleanly.
I found on https://mypy.readthedocs.io/en/stable/mypy_daemon.html that there is a ‘dmypy stop’ command, but it doesn’t seem to stop the existing daemons, so I killed ‘em.
Controlling GMD and XGMD
to see gui's to control lcls2-timing trigger inputs:
ssh kfe-console
$ cd /cds/group/pcds/epics/ioc/kfe/gmd/R3.1.0/gmdScreens
$ ./launch_gmd_main_pcds.sh
$ ./launch_xgmd_main_pcds.sh
or go to lcls-srv01 and run "lclshome"
for lcls1-timing (outdated) can find it in "kfe" gmd/xgmd tabs and goto
waveforms and then "timing" button.
To control the BLD rate: (from Marcio)
Press the Acq. Services on the main screen. Then click on the BLD tab. Then Rate Control. And, finally, on th
e BLD1 row, click on the button with a “…”.
Make sure to hit "enter" as each field is changed (will be "purple"
until enter is hit).
Note: the "rate limit" buttons don't affect anything for BLD
**********************************************************************
if someone puts gmd/xgmd in NC mode:
kfe-console:gmdScreens$ source /reg/g/pcds/pyps/conda/dev_conda
(pcds-5.7.3) kfe-console:gmdScreens$ caget TPR:FEES:MP01:0:TCRB:MODECTRL
TPR:FEES:MP01:0:TCRB:MODECTRL Crate=SC; LN=NC
(pcds-5.7.3) kfe-console:gmdScreens$
$ caget TPR:FEES:MP01:0:TCRB:MODECTRL
TPR:FEES:MP01:0:TCRB:MODECTRL Entire Crate=NC
$ caput TPR:FEES:MP01:0:TCRB:MODECTRL 3
Old : TPR:FEES:MP01:0:TCRB:MODECTRL Entire Crate=NC
New : TPR:FEES:MP01:0:TCRB:MODECTRL Crate=SC; LN=NC
(pcds-5.7.2) marcio@kfe-console ((no branch)) $ caput EM2K0:XGMD:HPS:SCSBR:FIXEDRATE 100Hz
Old : EM2K0:XGMD:HPS:SCSBR:FIXEDRATE 71.5kHz
New : EM2K0:XGMD:HPS:SCSBR:FIXEDRATE 100Hz
This is what Marcio wrote to Jeremy about someone switching timing
back to NC timing (lcls1):
Chris is talking about the crossbar control on shm-fees-sp01-1. We set SC timing to the backplane and sometim
es someone switches it back to NC.Note: the "rate limit" buttons don't affect anything for BLD
**********************************************************************
if someone puts gmd/xgmd in NC mode:
to get pv with info about bld payload on drp-srcf-cmp*:
export EPICS_PVA_SERVER_PORT=5181
export EPICS_PVA_BROADCAST_PORT=5180
export EPICS_PVA_ADDR_LIST=172.27.224.220
export EPICS_PVA_AUTO_ADDR_LIST=NOkfe-console:gmdScreens$ source /reg/g/pcds/pyps/conda/dev_conda
(pcds-5.7.3) kfe-console:gmdScreens$ caget TPR:FEES:MP01:0:TCRB:MODECTRL
TPR:FEES:MP01:0:TCRB:MODECTRL Crate=SC; LN=NC
(pcds-5.7.3) kfe-console:gmdScreens$
$ caget TPR:FEES:MP01:0:TCRB:MODECTRL
TPR:FEES:MP01:0:TCRB:MODECTRL Entire Crate=NC
$ caput TPR:FEES:MP01:0:TCRB:MODECTRL 3
Old : TPR:FEES:MP01:0:TCRB:MODECTRL Entire Crate=NC
New : TPR:FEES:MP01:0:TCRB:MODECTRL Crate=SC; LN=NCmarcio@drp-srcf-cmp001 $ pvinfo EM1K0:GMD:HPS:BLD_PAYLOAD
EM1K0:GMD:HPS:BLD_PAYLOAD
Server: 172.27.224.220:5181
Type:
epics:nt/NTScalar:1.0
structure BldPayload
float milliJoulesPerPulse
float RMS_E1
(pcds-5.7.23) marcio@kfe-console ((no branch)) $ caput marcio@drp-srcf-cmp001 $ pvinfo EM2K0:XGMD:HPS:SCSBR:FIXEDRATE 100Hz
Old : BLD_PAYLOAD
EM2K0:XGMD:HPS:SCSBR:FIXEDRATE 71.5kHz
New : EM2K0:XGMD:HPS:SCSBR:FIXEDRATE 100Hz
This is what Marcio wrote to Jeremy about someone switching timing
back to NC timing (lcls1):
Chris is talking about the crossbar control on shm-fees-sp01-1. We set SC timing to the backplane and sometim
es someone switches it back to NC.BLD_PAYLOAD
Server: 172.27.224.220:5181
Type:
epics:nt/NTScalar:1.0
structure BldPayload
float milliJoulesPerPulse
float POSY
float RMS_E1
float RMS_E2
**********************************************************************
bypassing the gateways:
(ps-4.6.0) to get pv with info about bld payload on drp-srcf-cmp*:export EPICS_PVA_SERVER_PORT=5181
export EPICS_PVA_BROADCAST_PORT=5180
export EPICS_PVA_ADDR_LIST=172.27.224.220
export EPICS_PVA_AUTO_ADDR_LIST=NO
(pcds-5.7.3) marcio@drp-srcf-cmp001 $ pvinfo cmp025:lcls2$ cainfo EM1K0:GMD:HPS:STR0:STREAM_DOUBLE0
EM1K0:GMD:HPS:STR0:STREAM_DOUBLE0
State: connected
Host: pscag01-daq-drp.pcdsn:35892
Access: read, write
Native data type: DBF_DOUBLE
Request type: DBR_DOUBLE
Element count: 4096
(ps-4.6.0) drp-srcf-cmp025:lcls2$ export EPICS_CA_AUTO_ADDR_LIST=NO
(ps-4.6.0) drp-srcf-cmp025:lcls2$ export EPICS_CA_ADDR_LIST=172.27.131.255:5068
(ps-4.6.0) drp-srcf-cmp025:lcls2$ cainfo EM1K0:GMD:HPS:BLDSTR0:STREAM_PAYLOADDOUBLE0
EM1K0:GMD:HPS:STR0:BLDSTREAM_PAYLOAD
Server: 172.27.224.220:5181
Type:
DOUBLE0
epics:nt/NTScalar:1.0
State: structure BldPayload connected
Host: float milliJoulesPerPulse
float RMS_E1(pcds-5.7.3) marcio@drp-srcf-cmp001 $ pvinfo EM2K0:XGMD:HPS:BLD_PAYLOAD
EM2K0:XGMD:HPS:BLD_PAYLOAD
Server: 172.27.224128.220:5181
Type:162:34555
epics:nt/NTScalar:1.0
Access: structure BldPayload
float milliJoulesPerPulse
float POSY
float RMS_E1
float RMS_E2
**********************************************************************
read, write
Native data type: DBF_DOUBLE
Request type: DBR_DOUBLE
Element count: 4096
(ps-4.6.0) drp-srcf-cmp025:lcls2$ export EPICS_CA_ADDR_LIST=172.27.128.162:5068bypassing the gateways:
(ps-4.6.0) drp-srcf-cmp025:lcls2$ cainfo EM1K0:GMD:HPS:STR0:STREAM_DOUBLE0
EM1K0:GMD:HPS:STR0:STREAM_DOUBLE0
State: connected
Host: 172.27.128.162:34555
Access: read, write
Native data type: DBF_DOUBLE
Request type: DBR_DOUBLE
pscag01-daq-drp.pcdsn:35892
Access: read, write
Native data type: DBF_DOUBLE
Request type: DBR_DOUBLE
Element count: 4096
(ps-4.6.0) drp-srcf-cmp025:lcls2$ export EPICS_CA_AUTO_ADDR_LIST=NO
(ps-4.6.0) drp-srcf-cmp025:lcls2$ export EPICS_CA_ADDR_LIST=172.27.131.255:5068
(ps-4.6.0) drp-srcf-cmp025:lcls2$ cainfo EM1K0:GMD:HPS:STR0:STREAM_DOUBLE0
EM1K0:GMD:HPS:STR0:STREAM_DOUBLE0
State: connected
Host: 172.27.128.162:34555
Access: read, write
Native data type: DBF_DOUBLE
Request type: DBR_DOUBLE
Element count: 4096
(ps-4.6.0) drp-srcf-cmp025:lcls2$ export EPICS_CA_ADDR_LIST=172.27.128.162:5068
(ps-4.6.0) drp-srcf-cmp025:lcls2$ cainfo EM1K0:GMD:HPS:STR0:STREAM_DOUBLE0
EM1K0:GMD:HPS:STR0:STREAM_DOUBLE0
State: connected
Host: 172.27.128.162:34555
Access: read, write
Native data type: DBF_DOUBLE
Request type: DBR_DOUBLE
Element count: 4096
(ps-4.6.0) drp-srcf-cmp025:lcls2$ ifconfig | grep "inet "
Infiniband hardware address can be incorrect! Please read BUGS section in ifconfig(8).
inet 172.21.152.46 netmask 255.255.252.0 broadcast 172.21.155.255
inet 172.21.164.46 netmask 255.255.252.0 broadcast 172.21.167.255
inet 127.0.0.1 netmask 255.0.0.0 Element count: 4096
(ps-4.6.0) drp-srcf-cmp025:lcls2$ ifconfig | grep "inet "
Infiniband hardware address can be incorrect! Please read BUGS section in ifconfig(8).
inet 172.21.152.46 netmask 255.255.252.0 broadcast 172.21.155.255
inet 172.21.164.46 netmask 255.255.252.0 broadcast 172.21.167.255
inet 127.0.0.1 netmask 255.0.0.0
WEKA
If weka is stuck on a node try the following, which I think requires that you be listed in the psdatmgr .k5login file (easy to do):
| Code Block |
|---|
drp-srcf-cmp007:~$ kinit
Password for cpo@SLAC.STANFORD.EDU:
drp-srcf-cmp007:~$ ssh psdatmgr@drp-srcf-cmp007
Last login: Thu Jun  6 13:34:06 2024 from drp-srcf-cmp007.pcdsn
<stuff removed>
-bash-4.2$ whoami
psdatmgr
-bash-4.2$ weka status
WekaIO v4.3.1 (CLI build 4.2.7.64)

       cluster: slac-ffb (48d60028-235e-4378-8f1b-a17d711514a6)
        status: OK (48 backend containers UP, 128 drives UP)
    protection: 12+2 (Fully protected)
     hot spare: 1 failure domains (70.03 TiB)
 drive storage: 910.56 TiB total
         cloud: connected (via proxy)
       license: OK, valid thru 2032-12-16T22:03:30Z

     io status: STARTED 339 days ago (192 io-nodes UP, 252 Buckets UP)
    link layer: Infiniband + Ethernet
       clients: 343 connected, 1 disconnected
         reads: 0 B/s (0 IO/s)
        writes: 0 B/s (0 IO/s)
    operations: 29 ops/s
        alerts: 7 active alerts, use `weka alerts` to list them

-bash-4.2$ weka local status
Weka v4.2.7.64 (CLI build 4.2.7.64)
Cgroups: mode=auto, enabled=true

Containers: 1/1 running (1 weka)
Nodes: 4/4 running (4 READY)
Mounts: 1

To view additional information run 'weka local status -v'
-bash-4.2$ |
Overview
Content Tools