/Probl
| Table of Contents |
|---|
Motivation
...
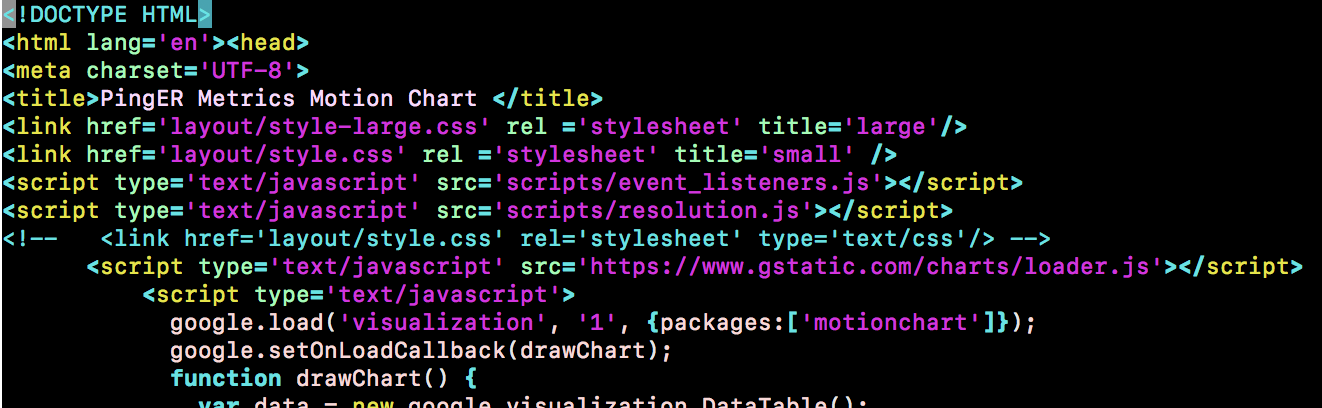
To create a motion chart, the data must be populated in a data structure (as stated by Google Visualization APIand and copied below):
| Code Block |
|---|
<html>
  <head>
    <script type="text/javascript" src="http://www.google.com/jsapi"></script>
    <script type="text/javascript">
      google.load("visualization", "1", {packages:["motionchart"]});
      google.setOnLoadCallback(drawChart);
      function drawChart() {
        var data = new google.visualization.DataTable();

              data.addColumn('string', 'Country');
              data.addColumn('date', 'Month');
              data.addColumn('string', 'Region');
              data.addColumn('number', 'Average RTT (ms)');
              data.addColumn('number', 'Normalized Throughput (Kbps)');
              data.addColumn('number', 'Internet Users (#)');
              data.addColumn('number', 'Internet Penetration (%)');
              data.addColumn('number', 'Population (#)');
              data.addColumn('number', 'Minimum RTT (ms)');
              data.addColumn('number', 'Packet Loss (%)');
              data.addColumn('number', 'Unreachability (%)');
              data.addColumn('number', 'Jitter (ms)');
              data.addColumn('number', 'DOI Index');
              data.addColumn('number', 'HDI Index');

              data.addRows(1);
              data.setValue(0, 0, "Pakistan");
              data.setValue(0, 1, new Date(2007,02,01));
              data.setValue(0, 2, 'South Asia');
              data.setValue(0, 3, 421.346);
              data.setValue(0, 4, 1568.95315647059);
              data.setValue(0, 5, 7500000);
              data.setValue(0, 6, 4.7);
              data.setValue(0, 7, 172800051);
              data.setValue(0, 8, 311.482);
              data.setValue(0, 9, 1.331);
              data.setValue(0, 10, 15.591);
              data.setValue(0, 11, 19.906);
              data.setValue(0, 12, 0.26);
              data.setValue(0, 13, 0.551);

              data.addRows(1);
              data.setValue(1, 0, "Sri Lanka");
              data.setValue(1, 1, new Date(2007,02,01));
              data.setValue(1, 2, 'South Asia');
              data.setValue(1, 3, 418.664);
              data.setValue(1, 4, 2760.35944717647);
              data.setValue(1, 5, 280000);
              data.setValue(1, 6, 1.4);
              data.setValue(1, 7, 21128773);
              data.setValue(1, 8, 270.494);
              data.setValue(1, 9, 0.304);
              data.setValue(1, 10, 8.871);
              data.setValue(1, 11, 42.093);
              data.setValue(1, 12, 0.33);
              data.setValue(1, 13, 0.743);


              data.addRows(1);
              data.setValue(2, 0, "Pakistan");
              data.setValue(2, 1, new Date(2007,03,01));
              data.setValue(2, 2, 'South Asia');
              data.setValue(2, 3, 397.897);
              data.setValue(2, 4, 1394.21896911765);
              data.setValue(2, 5, 7500000);
              data.setValue(2, 6, 4.7);
              data.setValue(2, 7, 172800051);
              data.setValue(2, 8, 305.533);
              data.setValue(2, 9, 1.248);
              data.setValue(2, 10, 12.917);
              data.setValue(2, 11, 31.064);
              data.setValue(2, 12, 0.26);
              data.setValue(2, 13, 0.551);

              data.addRows(1);
              data.setValue(3, 0, "Sri Lanka");
              data.setValue(3, 1, new Date(2007,03,01));
              data.setValue(3, 2, 'South Asia');
              data.setValue(3, 3, 357.202);
              data.setValue(3, 4, 4634.87959694118);
              data.setValue(3, 5, 280000);
              data.setValue(3, 6, 1.4);
              data.setValue(3, 7, 21128773);
              data.setValue(3, 8, 274.092);
              data.setValue(3, 9, 0.144);
              data.setValue(3, 10, 36.319);
              data.setValue(3, 11, 11.889);
              data.setValue(3, 12, 0.33);
              data.setValue(3, 13, 0.743);


              data.addRows(1);
              data.setValue(4, 0, "Pakistan");
              data.setValue(4, 1, new Date(2007,04,01));
              data.setValue(4, 2, 'South Asia');
              data.setValue(4, 3, 372.313);
              data.setValue(4, 4, 1918.28198552422);
              data.setValue(4, 5, 7500000);
              data.setValue(4, 6, 4.7);
              data.setValue(4, 7, 172800051);
              data.setValue(4, 8, 310.145);
              data.setValue(4, 9, 0.969);
              data.setValue(4, 10, 13.844);
              data.setValue(4, 11, 24.146);
              data.setValue(4, 12, 0.26);
              data.setValue(4, 13, 0.551);

              data.addRows(1);
              data.setValue(5, 0, "Sri Lanka");
              data.setValue(5, 1, new Date(2007,04,01));
              data.setValue(5, 2, 'South Asia');
              data.setValue(5, 3, 397.434);
              data.setValue(5, 4, 2450.70159022405);
              data.setValue(5, 5, 280000);
              data.setValue(5, 6, 1.4);
              data.setValue(5, 7, 21128773);
              data.setValue(5, 8, 298.214);
              data.setValue(5, 9, 0.410);
              data.setValue(5, 10, 7.527);
              data.setValue(5, 11, 6.979);
              data.setValue(5, 12, 0.33);
              data.setValue(5, 13, 0.743);

        var chart = new google.visualization.MotionChart(document.getElementById('chart_div'));
        chart.draw(data, {width: 850, height:500});
      }
    </script>
  </head>

  <body>
    <div id="chart_div" style="width: 850px; height: 500px;"></div>
  </body>
</html>
|
The data must comply with the formatting requirements (as stated by Google Visualization APIand and copied below):
- The first column must be of type 'string' and contain the entity names (e.g., "Pakistan", "Sri Lanka" in the example above).
- The second column must contain time values. Time can be expressed in a few different ways:
- Years. Column type: 'number'. Example: 2008.
- Month, day and year. Column type should be 'date' and the values should be javascript Date instances.
- Week numbers. Column type should be 'string' and the values should have the pattern YYYYWww, which conforms to ISO 8601. Example: '2008W03'.
- Quarters. Column type should be 'string' and the values should have the pattern YYYYQq, which conforms to ISO 8601. Example: '2008Q3'.
- Subsequent columns can be of type 'number' or 'string'. Number columns will show up in the drop down menus for X, Y, Color and Size axes. String columns will only appear in the drop down menu for Color.
...
| No Format |
|---|
Flat file listing the statistics: /afs/slac/package/pinger/motion-chart/demographics.csv The file looks like: #Country, Year, population, inetusers, inetpenetration, doi, hdi, cpi, idi Afghanistan, 1998, 22912814, 0, 0.1, 0, , 0, 0 ... Afghanistan, 2019, 37209007, 0, 11.45, 0, 0.498, 0, 1.95 The script to generate csv files (each reflecting records for a single statistic): /afs/slac/package/pinger/motion-chart/generate-csv-from-demographics.pl* The script to generate demographics.csv from the independent csv files: /afs/slac/package/pinger/motion-chart/generate-demographics-from-csv.pl* |
...
| No Format |
|---|
CPI: /afs/slac/package/pinger/motion-chart/cpi.csv #Corruptions Perceptions Index from Transparency International DOI: /afs/slac/package/pinger/motion-chart/doi.csv #Digital Opportunity Index from ITU HDI: /afs/slac/package/pinger/motion-chart/hdi.csv #Human Development Index from UNDP IDI: /afs/slac/package/pinger/motion-chart/idi.csv #ICT Development Index from ITU Internet Penetration: /afs/slac/package/pinger/motion-chart/inetpenetration.csv Internet Users: /afs/slac/package/pinger/motion-chart/inetusers.csv Population: Appears as: Country, 1998, 1999, 2000, 2001, 2002, 2003, 2004, 2005, 2006, 2007, 2008, 2009, 2010, 2011, 2012, 2013, 2014, 2015, 2016, 2017, 2018, 2019 Afghanistan, , , , , 0.373, 0.383, 0.398, 0.408, 0.417, 0.429, 0.437, 0.453, 0.463, 0.471, 0.482, 0.487, 0.491, 0.493, 0.494, 0.498, 0, 0.498 DOI: /afs/slac/package/pinger/motion-chart/popdoi.csv Note that#Digital theOpportunity formatIndex offrom these files is such that each row represents statistics of a country and the columns list the annual measurements. e.g. the hdi.csv has the following format: #Country, 1998, 1999, 2000, 2001, 2002, 2003, 2004, 2005, 2006, 2007, 2008, 2009 Albania, 0.801, 0.801, 0.801, 0.801, 0.801, 0.801, 0.801, 0.801, 0.801, 0.801, 0.801, 0.801 Algeria, 0.733, 0.733, 0.733, 0.733, 0.733, 0.733, 0.733, 0.733, 0.733, 0.733, 0.733, 0.733 AmericanSamoa, 0, 0, 0, 0, 0, 0, 0, 0, 0, 0, 0, 0 Note that the header of the intermediate csv files must be of the form: Country, 1998, 1999, 2000, 2001, 2002, 2003, 2004, 2005, 2006, 2007, 2008, 2009 |
Updating the records
:
| No Format |
|---|
1. Create a backup of the demographics.csv. This is just to avoid loss of information
    (in case of any error).
    (command: cp demographics.csv demographics.csv.back)
2. Execute the following command to generate the separate .csv files:
    ./generate-csv-from-demographics.pl
    This will generate the required files (cpi.csv, doi.csv, hdi.csv, inetpenetration.csv,
    inetusers.csv and pop.csv).
3. These separate csv files maintain records for a single statistic. Any update required
    to the demographics data should be made to these csv files. For example to add records
    for the year 2010, open each csv (for the separate statistic) in MS Excel and add
    another column. The header must state the correct year (note the file format). Similarly,
    to add countries to the records, add a row with the annual measurements separated by
    commas.
4. Once all the csv files have been updated, execute the script to generate the coalesced
    demographics statistics.
   ./generate-demographics-from-csv.pl
   This command would read the separate .csv files and generate an updated demographics.csv
   file.
|
There are certain conditions that must be met:
- All the files (the *.csv and *.pl) must be in the same folder.
- Both the scripts (.pl) are strongly dependent on the format of .csv files being correct.
- The order of execution must follow the steps listed above (i.e generate the separate csv files, edit them and then generate the new demographics.csv)
- The country names used here must be the same as those used by PingER. The source of the data presented here is mentioned in the section 'Miscellaneous Details'.
Both the scripts generate-csv-from-demographics.pl and generate-demographics-from-csv.pl take options as input parameters for customization.
Adding a new statistic would require simple changes(/additions) to the scripts below. The code is documented to facilitate this process.
| No Format |
|---|
/afs/slac/package/pinger/motion-chart/generate-csv-from-demographics.pl*
/afs/slac/package/pinger/motion-chart/generate-demographics-from-csv.pl*
|
Generating up-to-date PingER Metric Motion Charts
To generate up to date .html files of the PingER metric motion charts execute the following script:
| No Format |
|---|
/afs/slac/package/pinger/motion-chart/create-motion-chart-pages.pl
|
The charts generated (listed below) may then viewed publicly via SLAC's web server.
ITU
Appears as:
Country, 1998, 1999, 2000, 2001, 2002, 2003, 2004, 2005, 2006, 2007, 2008, 2009, 2010, 2011, 2012, 2013, 2014, 2015, 2016, 2017, 2018, 2019
Algeria, 0.39, 0.39, 0.39, 0.39, 0.39, 0.39, 0.39, 0.39, 0.42, 0.42, 0.42, 0.42, 0.42, 0, 0, 0, 0, 0, 0, 0, 0, 0

HDI: /afs/slac/package/pinger/motion-chart/hdi.csv #Human Development Index from UNDP
Appears as:
Country, 1998, 1999, 2000, 2001, 2002, 2003, 2004, 2005, 2006, 2007, 2008, 2009, 2010, 2011, 2012, 2013, 2014, 2015, 2016, 2017, 2018, 2019
Afghanistan, , , , , 0.373, 0.383, 0.398, 0.408, 0.417, 0.429, 0.437, 0.453, 0.463, 0.471, 0.482, 0.487, 0.491, 0.493, 0.494, 0.498, 0, 0.498

IDI: /afs/slac/package/pinger/motion-chart/idi.csv #ICT Development Index from ITU
Internet Penetration: /afs/slac/package/pinger/motion-chart/inetpenetration.csv
Appears as:
Country, 1998, 1999, 2000, 2001, 2002, 2003, 2004, 2005, 2006, 2007, 2008, 2009, 2010, 2011, 2012, 2013, 2014, 2015, 2016, 2017, 2018, 2019
Afghanistan, 0, 0, 0, 0, 0, 0, 0, 0, 0, 0, 0, 0, 1.71, 1.71, 1.71, 1.71, 1.71, 1.71, 1.71, 1.95, 1.95, 1.95

Internet Users: /afs/slac/package/pinger/motion-chart/inetusers.csv
Appears as:
Country, 1998, 1999, 2000, 2001, 2002, 2003, 2004, 2005, 2006, 2007, 2008, 2009, 2010, 2011, 2012, 2013, 2014, 2015, 2016, 2017, 2018, 2019
Afghanistan, 0, 0, 0, 1000, 1000, 20000, 25000, 300000, 535000, 500000, 500000, 1000000, 1000000, 0, 0, 0, 0, 0, 0, 0, 0, 0

Population: /afs/slac/package/pinger/motion-chart/pop.csv
Appears as:
Country, 1998, 1999, 2000, 2001, 2002, 2003, 2004, 2005, 2006, 2007, 2008, 2009, 2010, 2011, 2012, 2013, 2014, 2015, 2016, 2017, 2018, 2019
Afghanistan, 22912814, 23646128, 23898198, 23997412, 25268405, 27060359, 28513677, 29928987, 31056997, 31889923, 32738376, 28396000, 29121286, 30
019922, 30918557, 31817193, 32715829, 33614464, 34513100, 35411736, 36310371, 37209007

Note that the format of these files is such that each row represents statistics of a
country and the columns list the annual measurements. e.g. the hdi.csv has the
following format:
    #Country, 1998, 1999, 2000, 2001, 2002, 2003, 2004, 2005, 2006, 2007, 2008, 2009
    Albania, 0.801, 0.801, 0.801, 0.801, 0.801, 0.801, 0.801, 0.801, 0.801, 0.801, 0.801, 0.801
    Algeria, 0.733, 0.733, 0.733, 0.733, 0.733, 0.733, 0.733, 0.733, 0.733, 0.733, 0.733, 0.733
    AmericanSamoa, 0, 0, 0, 0, 0, 0, 0, 0, 0, 0, 0, 0

Note that the header of the intermediate csv files must be of the form:
Country, 1998, 1999, 2000, 2001, 2002, 2003, 2004, 2005, 2006, 2007, 2008, 2009
|
Updating the records
:
| No Format |
|---|
1. Create a backup of the demographics.csv. This is just to avoid loss of information
    (in case of any error).
    (command: cp demographics.csv demographics.csv.back)
2. Execute the following command to generate the separate .csv files:
    ./generate-csv-from-demographics.pl
    This will generate the required files (cpi.csv, doi.csv, hdi.csv, inetpenetration.csv,
    inetusers.csv and pop.csv).
3. These separate csv files maintain records for a single statistic. Any update required
    to the demographics data should be made to these csv files. For example to add records
    for the year 2010, open each csv (for the separate statistic) in MS Excel and add
    another column. The header must state the correct year (note the file format). Similarly,
    to add countries to the records, add a row with the annual measurements separated by
    commas.
4. Once all the csv files have been updated, execute the script to generate the coalesced
    demographics statistics.
   ./generate-demographics-from-csv.pl
   This command would read the separate .csv files and generate an updated demographics.csv
   file.
|
There are certain conditions that must be met:
- All the files (the *.csv and *.pl) must be in the same folder.
- Both the scripts (.pl) are strongly dependent on the format of .csv files being correct.
- The order of execution must follow the steps listed above (i.e generate the separate csv files, edit them and then generate the new demographics.csv)
- The country names used here must be the same as those used by PingER. The source of the data presented here is mentioned in the section 'Miscellaneous Details'.
Both the scripts generate-csv-from-demographics.pl and generate-demographics-from-csv.pl take options as input parameters for customization.
Adding a new statistic would require simple changes(/additions) to the scripts below. The code is documented to facilitate this process.
| No Format |
|---|
/afs/slac/package/pinger/motion-chart/generate-csv-from-demographics.pl*
/afs/slac/package/pinger/motion-chart/generate-demographics-from-csv.pl*
|
Generating up-to-date PingER Metric Motion Charts
To generate up to date .html files of the PingER metric motion charts execute the following script:
| No Format |
|---|
/afs/slac/package/pinger/motion-chart/create-motion-chart-pages.pl
|
The charts generated (listed below) may then viewed publicly via SLAC's web server at https://www-iepm.slac.stanford.edu/pinger/prmout/
| No Format |
|---|
| No Format |
/afs/slac/g/www/www-iepm/pinger/pinger-metrics-motion-chart-Africa-CH.CERN.N2-allyearly.html /afs/slac/g/www/www-iepm/pinger/pinger-metrics-motion-chart-Africa-CH.CERN.N2-last60days.html /afs/slac/g/www/www-iepm/pinger/pinger-metrics-motion-chart-Africa-CH.CERN.N2-monthly.html /afs/slac/g/www/www-iepm/pinger/pinger-metrics-motion-chart-Africa-EDU.SLAC.STANFORD.N3-allyearly.html /afs/slac/g/www/www-iepm/pinger/pinger-metrics-motion-chart-Africa-EDU.SLAC.STANFORD.N3-last60days.html /afs/slac/g/www/www-iepm/pinger/pinger-metrics-motion-chart-Africa-EDU.SLAC.STANFORD.N3-monthly.html /afs/slac/g/www/www-iepm/pinger/pinger-metrics-motion-chart-Africa-IT.ICTP.N1-allyearly.html /afs/slac/g/www/www-iepm/pinger/pinger-metrics-motion-chart-Africa-IT.ICTP.N1-last60days.html /afs/slac/g/www/www-iepm/pinger/pinger-metrics-motion-chart-Africa-IT.ICTP.N1-monthly.html /afs/slac/g/www/www-iepm/pinger/pinger-metrics-motion-chart-Balkans-CH.CERN.N2-allyearly.html /afs/slac/g/www/www-iepm/pinger/pinger-metrics-motion-chart-Balkans-CH.CERN.N2-last60days.html /afs/slac/g/www/www-iepm/pinger/pinger-metrics-motion-chart-Balkans-CH.CERN.N2-monthly.html /afs/slac/g/www/www-iepm/pinger/pinger-metrics-motion-chart-Balkans-EDU.SLAC.STANFORD.N3-allyearly.html /afs/slac/g/www/www-iepm/pinger/pinger-metrics-motion-chart-Balkans-EDU.SLAC.STANFORD.N3-last60days.html /afs/slac/g/www/www-iepm/pinger/pinger-metrics-motion-chart-Balkans-EDU.SLAC.STANFORD.N3-monthly.html /afs/slac/g/www/www-iepm/pinger/pinger-metrics-motion-chart-Balkans-IT.ICTP.N1-allyearly.html /afs/slac/g/www/www-iepm/pinger/pinger-metrics-motion-chart-Balkans-IT.ICTP.N1-last60days.html /afs/slac/g/www/www-iepm/pinger/pinger-metrics-motion-chart-Balkans-IT.ICTP.N1-monthly.html /afs/slac/g/www/www-iepm/pinger/pinger-metrics-motion-chart-Central_AsiaAfrica-CH.CERN.N2-allyearly.html /afs/slac/g/www/www-iepm/pinger/pinger-metrics-motion-chart-Central_AsiaAfrica-CH.CERN.N2-last60days.html /afs/slac/g/www/www-iepm/pinger/pinger-metrics-motion-chart-Central_AsiaAfrica-CH.CERN.N2-monthly.html /afs/slac/g/www/www-iepm/pinger/pinger-metrics-motion-chart-Central_AsiaAfrica-EDU.SLAC.STANFORD.N3-allyearly.html /afs/slac/g/www/www-iepm/pinger/pinger-metrics-motion-chart-Central_AsiaAfrica-EDU.SLAC.STANFORD.N3-last60days.html /afs/slac/g/www/www-iepm/pinger/pinger-metrics-motion-chart-Central_AsiaAfrica-EDU.SLAC.STANFORD.N3-monthly.html /afs/slac/g/www/www-iepm/pinger/pinger-metrics-motion-chart-Central_AsiaAfrica-IT.ICTP.N1-allyearly.html /afs/slac/g/www/www-iepm/pinger/pinger-metrics-motion-chart-Africa-Central_Asia-IT.ICTP.N1-last60days.html /afs/slac/g/www/www-iepm/pinger/pinger-metrics-motion-chart-Central_AsiaAfrica-IT.ICTP.N1-monthly.html /afs/slac/g/www/www-iepm/pinger/pinger-metrics-motion-chart-East_AsiaBalkans-CH.CERN.N2-allyearly.html /afs/slac/g/www/www-iepm/pinger/pinger-metrics-motion-chart-East_AsiaBalkans-CH.CERN.N2-last60days.html /afs/slac/g/www/www-iepm/pinger/pinger-metrics-motion-chart-East_AsiaBalkans-CH.CERN.N2-monthly.html /afs/slac/g/www/www-iepm/pinger/pinger-metrics-motion-chart-East_AsiaBalkans-EDU.SLAC.STANFORD.N3-allyearly.html /afs/slac/g/www/www-iepm/pinger/pinger-metrics-motion-chart-East_AsiaBalkans-EDU.SLAC.STANFORD.N3-last60days.html /afs/slac/g/www/www-iepm/pinger/pinger-metrics-motion-chart-East_AsiaBalkans-EDU.SLAC.STANFORD.N3-monthly.html /afs/slac/g/www/www-iepm/pinger/pinger-metrics-motion-chart-East_AsiaBalkans-IT.ICTP.N1-allyearly.html /afs/slac/g/www/www-iepm/pinger/pinger-metrics-motion-chart-East_AsiaBalkans-IT.ICTP.N1-last60days.html /afs/slac/g/www/www-iepm/pinger/pinger-metrics-motion-chart-East_AsiaBalkans-IT.ICTP.N1-monthly.html /afs/slac/g/www/www-iepm/pinger/pinger-metrics-motion-chart-EuropeCentral_Asia-CH.CERN.N2-allyearly.html /afs/slac/g/www/www-iepm/pinger/pinger-metrics-motion-chart-EuropeCentral_Asia-CH.CERN.N2-last60days.html /afs/slac/g/www/www-iepm/pinger/pinger-metrics-motion-chart-EuropeCentral_Asia-CH.CERN.N2-monthly.html /afs/slac/g/www/www-iepm/pinger/pinger-metrics-motion-chart-EuropeCentral_Asia-EDU.SLAC.STANFORD.N3-allyearly.html /afs/slac/g/www/www-iepm/pinger/pinger-metrics-motion-chart-EuropeCentral_Asia-EDU.SLAC.STANFORD.N3-last60days.html /afs/slac/g/www/www-iepm/pinger/pinger-metrics-motion-chart-EuropeCentral_Asia-EDU.SLAC.STANFORD.N3-monthly.html /afs/slac/g/www/www-iepm/pinger/pinger-metrics-motion-chart-EuropeCentral_Asia-IT.ICTP.N1-allyearly.html /afs/slac/g/www/www-iepm/pinger/pinger-metrics-motion-chart-EuropeCentral_Asia-IT.ICTP.N1-last60days.html /afs/slac/g/www/www-iepm/pinger/pinger-metrics-motion-chart-EuropeCentral_Asia-IT.ICTP.N1-monthly.html /afs/slac/g/www/www-iepm/pinger/pinger-metrics-motion-chart-LatinEast_AmericaAsia-CH.CERN.N2-allyearly.html /afs/slac/g/www/www-iepm/pinger/pinger-metrics-motion-chart-LatinEast_AmericaAsia-CH.CERN.N2-last60days.html /afs/slac/g/www/www-iepm/pinger/pinger-metrics-motion-chart-LatinEast_AmericaAsia-CH.CERN.N2-monthly.html /afs/slac/g/www/www-iepm/pinger/pinger-metrics-motion-chart-LatinEast_AmericaAsia-EDU.SLAC.STANFORD.N3-allyearly.html /afs/slac/g/www/www-iepm/pinger/pinger-metrics-motion-chart-LatinEast_AmericaAsia-EDU.SLAC.STANFORD.N3-last60days.html /afs/slac/g/www/www-iepm/pinger/pinger-metrics-motion-chart-LatinEast_AmericaAsia-EDU.SLAC.STANFORD.N3-monthly.html /afs/slac/g/www/www-iepm/pinger/pinger-metrics-motion-chart-LatinEast_AmericaAsia-IT.ICTP.N1-allyearly.html /afs/slac/g/www/www-iepm/pinger/pinger-metrics-motion-chart-LatinEast_AmericaAsia-IT.ICTP.N1-last60days.html /afs/slac/g/www/www-iepm/pinger/pinger-metrics-motion-chart-LatinEast_AmericaAsia-IT.ICTP.N1-monthly.html /afs/slac/g/www/www-iepm/pinger/pinger-metrics-motion-chart-Middle_EastEurope-CH.CERN.N2-allyearly.html /afs/slac/g/www/www-iepm/pinger/pinger-metrics-motion-chart-Middle_EastEurope-CH.CERN.N2-last60days.html /afs/slac/g/www/www-iepm/pinger/pinger-metrics-motion-chart-Middle_EastEurope-CH.CERN.N2-monthly.html /afs/slac/g/www/www-iepm/pinger/pinger-metrics-motion-chart-Middle_EastEurope-EDU.SLAC.STANFORD.N3-allyearly.html /afs/slac/g/www/www-iepm/pinger/pinger-metrics-motion-chart-Middle_EastEurope-EDU.SLAC.STANFORD.N3-last60days.html /afs/slac/g/www/www-iepm/pinger/pinger-metrics-motion-chart-Middle_EastEurope-EDU.SLAC.STANFORD.N3-monthly.html /afs/slac/g/www/www-iepm/pinger/pinger-metrics-motion-chart-Middle_EastEurope-IT.ICTP.N1-allyearly.html /afs/slac/g/www/www-iepm/pinger/pinger-metrics-motion-chart-Middle_EastEurope-IT.ICTP.N1-last60days.html /afs/slac/g/www/www-iepm/pinger/pinger-metrics-motion-chart-Middle_EastEurope-IT.ICTP.N1-monthly.html /afs/slac/g/www/www-iepm/pinger/pinger-metrics-motion-chart-NorthLatin_America-CH.CERN.N2-allyearly.html /afs/slac/g/www/www-iepm/pinger/pinger-metrics-motion-chart-NorthLatin_America-CH.CERN.N2-last60days.html /afs/slac/g/www/www-iepm/pinger/pinger-metrics-motion-chart-NorthLatin_America-CH.CERN.N2-monthly.html /afs/slac/g/www/www-iepm/pinger/pinger-metrics-motion-chart-NorthLatin_America-EDU.SLAC.STANFORD.N3-allyearly.html /afs/slac/g/www/www-iepm/pinger/pinger-metrics-motion-chart-NorthLatin_America-EDU.SLAC.STANFORD.N3-last60days.html /afs/slac/g/www/www-iepm/pinger/pinger-metrics-motion-chart-NorthLatin_America-EDU.SLAC.STANFORD.N3-monthly.html /afs/slac/g/www/www-iepm/pinger/pinger-metrics-motion-chart-NorthLatin_America-IT.ICTP.N1-allyearly.html /afs/slac/g/www/www-iepm/pinger/pinger-metrics-motion-chart-NorthLatin_America-IT.ICTP.N1-last60days.html /afs/slac/g/www/www-iepm/pinger/pinger-metrics-motion-chart-NorthLatin_America-IT.ICTP.N1-monthly.html /afs/slac/g/www/www-iepm/pinger/pinger-metrics-motion-chart-OceaniaMiddle_East-CH.CERN.N2-allyearly.html /afs/slac/g/www/www-iepm/pinger/pinger-metrics-motion-chart-OceaniaMiddle_East-CH.CERN.N2-last60days.html /afs/slac/g/www/www-iepm/pinger/pinger-metrics-motion-chart-OceaniaMiddle_East-CH.CERN.N2-monthly.html /afs/slac/g/www/www-iepm/pinger/pinger-metrics-motion-chart-OceaniaMiddle_East-EDU.SLAC.STANFORD.N3-allyearly.html /afs/slac/g/www/www-iepm/pinger/pinger-metrics-motion-chart-OceaniaMiddle_East-EDU.SLAC.STANFORD.N3-last60days.html /afs/slac/g/www/www-iepm/pinger/pinger-metrics-motion-chart-OceaniaMiddle_East-EDU.SLAC.STANFORD.N3-monthly.html /afs/slac/g/www/www-iepm/pinger/pinger-metrics-motion-chart-OceaniaMiddle_East-IT.ICTP.N1-allyearly.html /afs/slac/g/www/www-iepm/pinger/pinger-metrics-motion-chart-OceaniaMiddle_East-IT.ICTP.N1-last60days.html /afs/slac/g/www/www-iepm/pinger/pinger-metrics-motion-chart-OceaniaMiddle_East-IT.ICTP.N1-monthly.html /afs/slac/g/www/www-iepm/pinger/pinger-metrics-motion-chart-S.E._AsiaNorth_America-CH.CERN.N2-allyearly.html /afs/slac/g/www/www-iepm/pinger/pinger-metrics-motion-chart-S.E._AsiaNorth_America-CH.CERN.N2-last60days.html /afs/slac/g/www/www-iepm/pinger/pinger-metrics-motion-chart-S.E._AsiaNorth_America-CH.CERN.N2-monthly.html /afs/slac/g/www/www-iepm/pinger/pinger-metrics-motion-chart-S.E._AsiaNorth_America-EDU.SLAC.STANFORD.N3-allyearly.html /afs/slac/g/www/www-iepm/pinger/pinger-metrics-motion-chart-S.E._AsiaNorth_America-EDU.SLAC.STANFORD.N3-last60days.html /afs/slac/g/www/www-iepm/pinger/pinger-metrics-motion-chart-S.E._AsiaNorth_America-EDU.SLAC.STANFORD.N3-monthly.html /afs/slac/g/www/www-iepm/pinger/pinger-metrics-motion-chart-S.E._AsiaNorth_America-IT.ICTP.N1-allyearly.html /afs/slac/g/www/www-iepm/pinger/pinger-metrics-motion-chart-S.E._AsiaNorth_America-IT.ICTP.N1-last60days.html /afs/slac/g/www/www-iepm/pinger/pinger-metrics-motion-chart-S.E._AsiaNorth_America-IT.ICTP.N1-monthly.html /afs/slac/g/www/www-iepm/pinger/pinger-metrics-motion-chart-South_AsiaOceania-CH.CERN.N2-allyearly.html /afs/slac/g/www/www-iepm/pinger/pinger-metrics-motion-chart-South_AsiaOceania-CH.CERN.N2-last60days.html /afs/slac/g/www/www-iepm/pinger/pinger-metrics-motion-chart-South_AsiaOceania-CH.CERN.N2-monthly.html /afs/slac/g/www/www-iepm/pinger/pinger-metrics-motion-chart-South_AsiaOceania-EDU.SLAC.STANFORD.N3-allyearly.html /afs/slac/g/www/www-iepm/pinger/pinger-metrics-motion-chart-South_AsiaOceania-EDU.SLAC.STANFORD.N3-last60days.html /afs/slac/g/www/www-iepm/pinger/pinger-metrics-motion-chart-South_AsiaOceania-EDU.SLAC.STANFORD.N3-monthly.html /afs/slac/g/www/www-iepm/pinger/pinger-metrics-motion-chart-South_AsiaOceania-IT.ICTP.N1-allyearly.html /afs/slac/g/www/www-iepm/pinger/pinger-metrics-motion-chart-South_AsiaOceania-IT.ICTP.N1-last60days.html /afs/slac/g/www/www-iepm/pinger/pinger-metrics-motion-chart-South_AsiaOceania-IT.ICTP.N1-monthly.html /afs/slac/g/www/www-iepm/pinger/pinger-metrics-motion-chart-allS.E._Asia-CH.CERN.N2-allyearly.html /afs/slac/g/www/www-iepm/pinger/pinger-metrics-motion-chart-allS.E._Asia-CH.CERN.N2-last60days.html /afs/slac/g/www/www-iepm/pinger/pinger-metrics-motion-chart-allS.E._Asia-CH.CERN.N2-monthly.html /afs/slac/g/www/www-iepm/pinger/pinger-metrics-motion-chart-allS.E._Asia-EDU.SLAC.STANFORD.N3-allyearly.html /afs/slac/g/www/www-iepm/pinger/pinger-metrics-motion-chart-allS.E._Asia-EDU.SLAC.STANFORD.N3-last60days.html /afs/slac/g/www/www-iepm/pinger/pinger-metrics-motion-chart-allS.E._Asia-EDU.SLAC.STANFORD.N3-monthly.html /afs/slac/g/www/www-iepm/pinger/pinger-metrics-motion-chart-allS.E._Asia-IT.ICTP.N1-allyearly.html /afs/slac/g/www/www-iepm/pinger/pinger-metrics-motion-chart-allS.E._Asia-IT.ICTP.N1-last60days.html /afs/slac/g/www/www-iepm/pinger/pinger-metrics-motion-chart-allS.E._Asia-IT.ICTP.N1-monthly.html |
Miscellaneous Details
- Tool: The interactive graph was generated using the Google Motion Chart Widget.
- Data: The data presented here was collected by the PingER project, processed by prmout. The same data is available in tabular format. The statistics of Population were acquired from the U.S. Census Bureau, the country to region mapping was obtained by the geographical database maintained by the PingER project, where as the Internet usage statistics were taken from Internet World Stats. Please note that while all the statistics were acquired over several years (i.e. since 1998), the Internet usage statistics were documented in Nov. 2007.
- Loading: The time to load and render the web page is largely determined speed of the link, the file length (about a MByte that is determined by the number of metrics and frequency of data points and the number of metrics) and the speed of the client rendering.
- Metrics: Average RTT (ms), Normalized Throughput (Kbps), Internet Users (#), Internet Penetration (%), Population (#), Minimum RTT (ms), Packet Loss (%), Unreachability (%), Jitter (ms), DOI Index, HDI Index,
- Authors: Umar Kalim & Les Cottrell 10/10/2008, version 1.3. Idea champion: Shahryar Khan.
Problems
Sometimes instead of balloons, stars or asterisks are displayed. Try a complete refersh(CTRL-Refresh).
Due to unavailability of data for population and internet users for 2011, the static version of demographics.csv was generated. Instead of generating the demographics.csv from the script generate-demographics-from-csv.pl use the static version of demographics.csv.
Internet users and population have to be integer values. If these are decimal values, the HTML page chart fails to generate even though create-motion-chart-pages.pl runs fine.
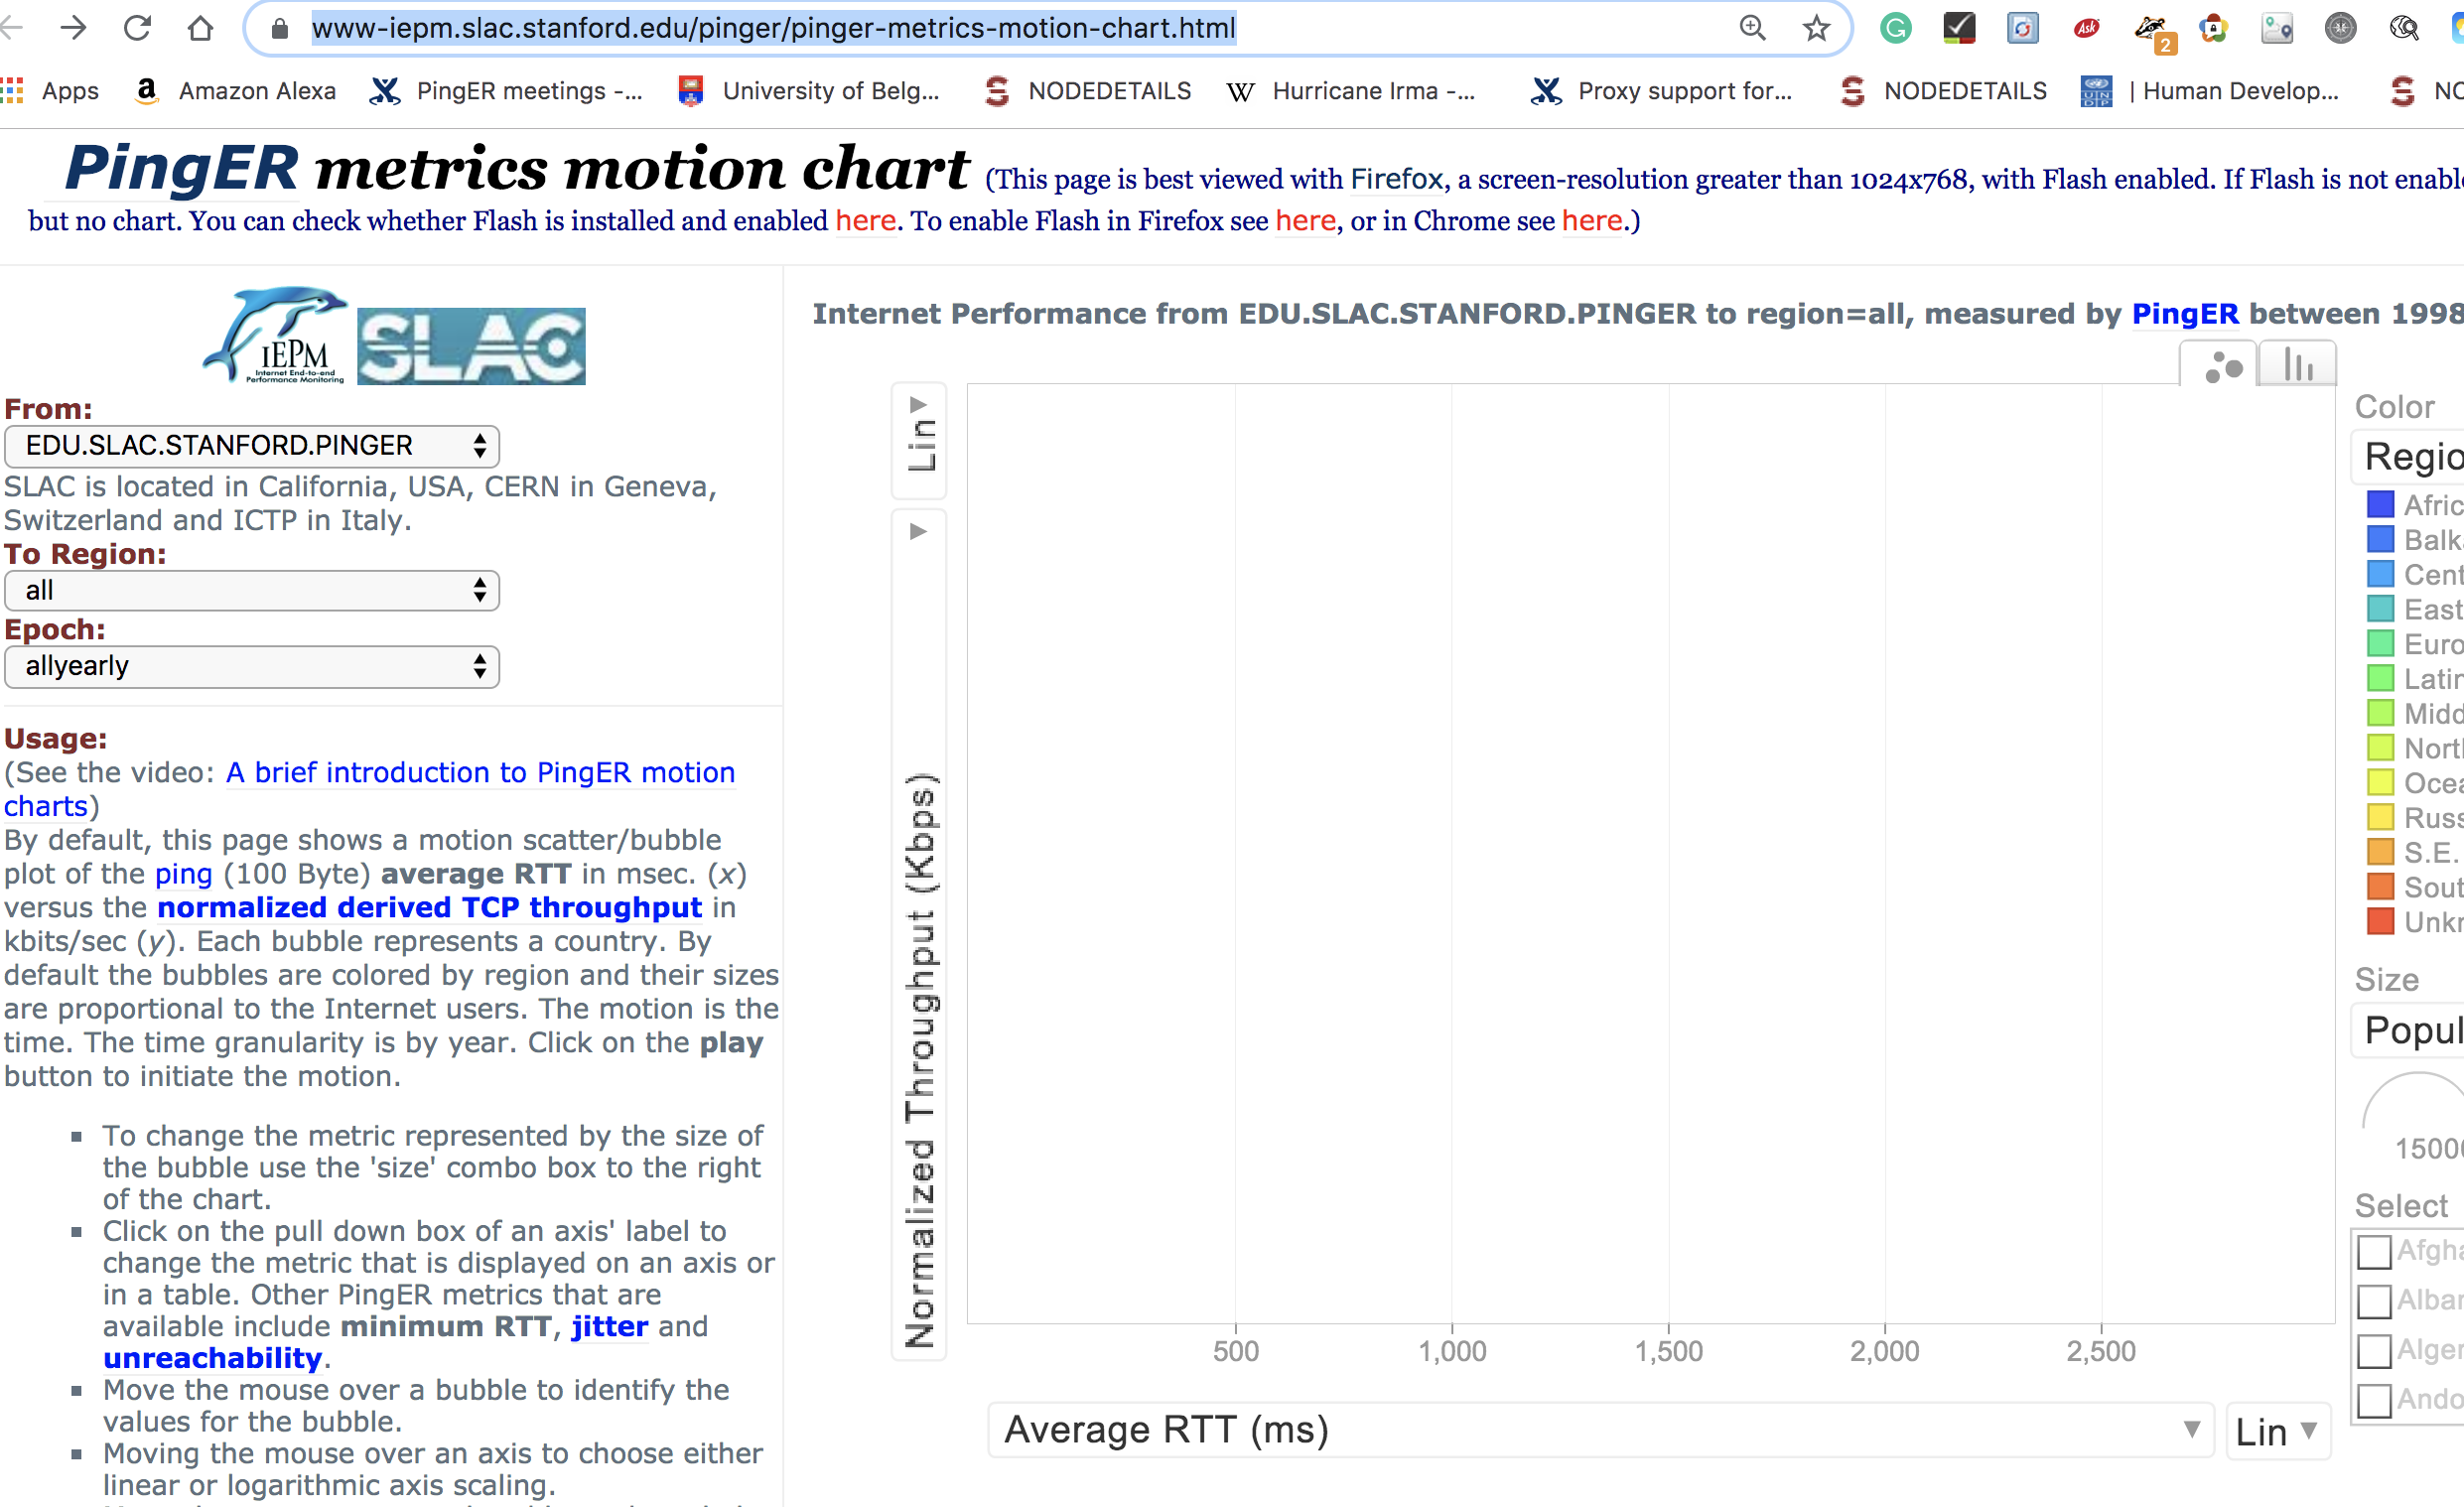
The text appears but no chart. You probably need to enable flash.
Anomalous values of throughput
...
/afs/slac/g/www/www-iepm/pinger/pinger-metrics-motion-chart-South_Asia-CH.CERN.N2-allyearly.html
/afs/slac/g/www/www-iepm/pinger/pinger-metrics-motion-chart-South_Asia-CH.CERN.N2-last60days.html
/afs/slac/g/www/www-iepm/pinger/pinger-metrics-motion-chart-South_Asia-CH.CERN.N2-monthly.html
/afs/slac/g/www/www-iepm/pinger/pinger-metrics-motion-chart-South_Asia-EDU.SLAC.STANFORD.N3-allyearly.html
/afs/slac/g/www/www-iepm/pinger/pinger-metrics-motion-chart-South_Asia-EDU.SLAC.STANFORD.N3-last60days.html
/afs/slac/g/www/www-iepm/pinger/pinger-metrics-motion-chart-South_Asia-EDU.SLAC.STANFORD.N3-monthly.html
/afs/slac/g/www/www-iepm/pinger/pinger-metrics-motion-chart-South_Asia-IT.ICTP.N1-allyearly.html
/afs/slac/g/www/www-iepm/pinger/pinger-metrics-motion-chart-South_Asia-IT.ICTP.N1-last60days.html
/afs/slac/g/www/www-iepm/pinger/pinger-metrics-motion-chart-South_Asia-IT.ICTP.N1-monthly.html
/afs/slac/g/www/www-iepm/pinger/pinger-metrics-motion-chart-all-CH.CERN.N2-allyearly.html
/afs/slac/g/www/www-iepm/pinger/pinger-metrics-motion-chart-all-CH.CERN.N2-last60days.html
/afs/slac/g/www/www-iepm/pinger/pinger-metrics-motion-chart-all-CH.CERN.N2-monthly.html
/afs/slac/g/www/www-iepm/pinger/pinger-metrics-motion-chart-all-EDU.SLAC.STANFORD.N3-allyearly.html
/afs/slac/g/www/www-iepm/pinger/pinger-metrics-motion-chart-all-EDU.SLAC.STANFORD.N3-last60days.html
/afs/slac/g/www/www-iepm/pinger/pinger-metrics-motion-chart-all-EDU.SLAC.STANFORD.N3-monthly.html
/afs/slac/g/www/www-iepm/pinger/pinger-metrics-motion-chart-all-IT.ICTP.N1-allyearly.html
/afs/slac/g/www/www-iepm/pinger/pinger-metrics-motion-chart-all-IT.ICTP.N1-last60days.html
/afs/slac/g/www/www-iepm/pinger/pinger-metrics-motion-chart-all-IT.ICTP.N1-monthly.html
|
Miscellaneous Details
- Tool: The interactive graph was generated using the Google Motion Chart Widget.
- Data: The data presented here was collected by the PingER project, processed by prmout. The same data is available in tabular format. The statistics of Population were acquired from the U.S. Census Bureau, the country to region mapping was obtained by the geographical database maintained by the PingER project, where as the Internet usage statistics were taken from Internet World Stats. Please note that while all the statistics were acquired over several years (i.e. since 1998), the Internet usage statistics were documented in Nov. 2007.
- Loading: The time to load and render the web page is largely determined speed of the link, the file length (about a MByte that is determined by the number of metrics and frequency of data points and the number of metrics) and the speed of the client rendering.
- Metrics: Average RTT (ms), Normalized Throughput (Kbps), Internet Users (#), Internet Penetration (%), Population (#), Minimum RTT (ms), Packet Loss (%), Unreachability (%), Jitter (ms), DOI Index, HDI Index,
- Authors: Umar Kalim & Les Cottrell 10/10/2008, version 1.3. Idea champion: Shahryar Khan.
Problems
Sometimes instead of balloons, stars or asterisks are displayed. Try a complete refresh (CTRL-Refresh).
Due to unavailability of data for population and internet users for 2011, the static version of demographics.csv was generated. Instead of generating the demographics.csv from the script generate-demographics-from-csv.pl use the static version of demographics.csv.
Internet users and population have to be integer values. If these are decimal values, the HTML page chart fails to generate even though create-motion-chart-pages.pl runs fine.
The text appears but no chart. You probably need to enable flash.
Anomalous values of throughput
| Include Page | ||||
|---|---|---|---|---|
|
Tar'ing files
| Code Block |
|---|
[cottrell@pinger ~]$ tar -cvf umar.tar /afs/slac/package/pinger/motion-chart
tar: Removing leading `/' from member names

/afs/slac/package/pinger/motion-chart/

/afs/slac/package/pinger/motion-chart/generate-demographics-from-csv.pl

/afs/slac/package/pinger/motion-chart/generate-csv-from-demographics.pl

/afs/slac/package/pinger/motion-chart/inetusers.csv

/afs/slac/package/pinger/motion-chart/population.csv

/afs/slac/package/pinger/motion-chart/demographics.csv

/afs/slac/package/pinger/motion-chart/log.stdout

/afs/slac/package/pinger/motion-chart/backup-2009/

/afs/slac/package/pinger/motion-chart/backup-2009/generate-csv-from-demographics.pl

/afs/slac/package/pinger/motion-chart/backup-2009/generate-demographics-from-csv.pl

/afs/slac/package/pinger/motion-chart/backup-2009/inetusers.csv

/afs/slac/package/pinger/motion-chart/backup-2009/demographics.csv

/afs/slac/package/pinger/motion-chart/backup-2009/inetpenetration.csv

/afs/slac/package/pinger/motion-chart/backup-2009/idi.csv

/afs/slac/package/pinger/motion-chart/backup-2009/hdi.csv

/afs/slac/package/pinger/motion-chart/backup-2009/cpi.csv

/afs/slac/package/pinger/motion-chart/backup-2009/doi.csv

/afs/slac/package/pinger/motion-chart/backup-2009/create-motion-chart-pages.pl

/afs/slac/package/pinger/motion-chart/backup-2009/pop.csv

/afs/slac/package/pinger/motion-chart/backup-2009/create-motion-chart-page.pl

/afs/slac/package/pinger/motion-chart/backup-2009/log.conf

/afs/slac/package/pinger/motion-chart/backup-2008/

/afs/slac/package/pinger/motion-chart/backup-2008/population.csv

/afs/slac/package/pinger/motion-chart/backup-2008/population.csv.old2

/afs/slac/package/pinger/motion-chart/backup-2008/demographics.csv

/afs/slac/package/pinger/motion-chart/backup-2008/population.csv.old3

/afs/slac/package/pinger/motion-chart/backup-2008/population.csv.old4

/afs/slac/package/pinger/motion-chart/backup-2008/create-motion-chart-page.pl.bak

/afs/slac/package/pinger/motion-chart/backup-2008/create-motion-chart-page.pl.old2

/afs/slac/package/pinger/motion-chart/backup-2008/create-motion-chart-pages.pl

/afs/slac/package/pinger/motion-chart/backup-2008/population-old.csv

/afs/slac/package/pinger/motion-chart/backup-2008/population.csv.old

/afs/slac/package/pinger/motion-chart/backup-2008/create-motion-chart-page.pl

/afs/slac/package/pinger/motion-chart/backup-2008/generate-pinger-metrics-chart.sh

/afs/slac/package/pinger/motion-chart/backup-2008/create-motion-chart-page.pl.old

/afs/slac/package/pinger/motion-chart/backup-2008/create-motion-chart-pages.pl.bak

/afs/slac/package/pinger/motion-chart/generate-csv-from-demographics.v1.pl.bak

/afs/slac/package/pinger/motion-chart/generate-demographics-from-csv.v1.pl.bak

/afs/slac/package/pinger/motion-chart/inetpenetration.csv

/afs/slac/package/pinger/motion-chart/.demographics.csv.swp

/afs/slac/package/pinger/motion-chart/idi.csv

/afs/slac/package/pinger/motion-chart/hdi.csv

/afs/slac/package/pinger/motion-chart/cpi.csv

/afs/slac/package/pinger/motion-chart/doi.csv

/afs/slac/package/pinger/motion-chart/log.conf.bk

/afs/slac/package/pinger/motion-chart/.create-motion-chart-page.pl.swp

/afs/slac/package/pinger/motion-chart/create-motion-chart-pages.pl

/afs/slac/package/pinger/motion-chart/.population.csv.swp

/afs/slac/package/pinger/motion-chart/demographics.csv.bk

/afs/slac/package/pinger/motion-chart/pop.csv

/afs/slac/package/pinger/motion-chart/create-motion-chart-page.pl

/afs/slac/package/pinger/motion-chart/log.conf

/afs/slac/package/pinger/motion-chart/logs/

/afs/slac/package/pinger/motion-chart/logs/log.stdout

/afs/slac/package/pinger/motion-chart/logs/archives/

/afs/slac/package/pinger/motion-chart/logs/archives/motion_chart.log.2009-10-09.tar.gz

/afs/slac/package/pinger/motion-chart/logs/archives/motion_chart.log.2009-10-11.tar.gz

/afs/slac/package/pinger/motion-chart/logs/archives/motion_chart.log.2009-10-13.tar.gz

/afs/slac/package/pinger/motion-chart/logs/archives/motion_chart.log.2009-10-12.tar.gz

/afs/slac/package/pinger/motion-chart/logs/archives/motion_chart.log.2009-10-10.tar.gz

/afs/slac/package/pinger/motion-chart/logs/manage-logs.pl

/afs/slac/package/pinger/motion-chart/backup-2010/

/afs/slac/package/pinger/motion-chart/backup-2010/inetusers.csv

/afs/slac/package/pinger/motion-chart/backup-2010/demographics.csv

/afs/slac/package/pinger/motion-chart/backup-2010/inetpenetration.csv

/afs/slac/package/pinger/motion-chart/backup-2010/idi.csv

/afs/slac/package/pinger/motion-chart/backup-2010/hdi.csv

/afs/slac/package/pinger/motion-chart/backup-2010/cpi.csv

/afs/slac/package/pinger/motion-chart/backup-2010/doi.csv

/afs/slac/package/pinger/motion-chart/backup-2010/create-motion-chart-pages.pl

/afs/slac/package/pinger/motion-chart/backup-2010/pop.csv

/afs/slac/package/pinger/motion-chart/backup-2010/create-motion-chart-page.pl

/afs/slac/package/pinger/motion-chart/.create-motion-chart-page.pl.swo

/afs/slac/package/pinger/motion-chart/idi-20100809.csv

/afs/slac/package/pinger/motion-chart/pop-20190629.csv

/afs/slac/package/pinger/motion-chart/demographics-20190630.csv

/afs/slac/package/pinger/motion-chart/junk

/afs/slac/package/pinger/motion-chart/ir.csv

/afs/slac/package/pinger/motion-chart/ye.csv

/afs/slac/package/pinger/motion-chart/.generate-demographics-from-csv.pl.swp

/afs/slac/package/pinger/motion-chart/demographics-20190713.csv

/afs/slac/package/pinger/motion-chart/demographics-20190714.csv

/afs/slac/package/pinger/motion-chart/demographics-20190714-new.csv

[cottrell@pinger ~]$ ls -l umar.tar

-rw-r--r-- 1 cottrell sf 7884800 Sep 23 14:59 umar.tar
|
Or with compression which reduces the tarball from 7,884,800 Bytes to 1,509,685 Bytes
| Code Block |
|---|
[cottrell@pinger ~]$ tar -czvf umar.tar.gz /afs/slac/package/pinger/motion-chart


tar: Removing leading `/' from member names

/afs/slac/package/pinger/motion-chart/

/afs/slac/package/pinger/motion-chart/generate-demographics-from-csv.pl


...
[cottrell@pinger ~]$ ls -l  umar.tar.gz

-rw-r--r-- 1 cottrell sf 1509685 Sep 23 15:07 umar.tar.gz
|
In addition one will also need to access:
- The prm directory files. These are available via the web URL https://www-iepm.slac.stanford.edu/pinger/prmout/
- The file /afs/slac.stanford.edu/slac/www/comp/net/mon/countries.csv. This is also available via the web at http://www.slac.stanford.edu/comp/net/mon/countries.tsv
- The actual source of the web file https://www-iepm.slac.stanford.edu/pinger/pinger-metrics-motion-chart.html can be viewed from Chrome by ctrl-click to the left of the y axis label and choosing view source.
The anonymous ftp space for user cottrell is at /afs/slac/public/users/cottrell, thus all we need to do is cp umar.tar.gz /afs/slac/public/users/cottrell
[cottrell@pinger ~]$ cp umar.tar.gz /afs/slac/public/users/cottrell/
[cottrell@pinger ~]$ ls -l /afs/slac/public/users/cottrell/umar.tar.gz
-rw-r--r-- 1 cottrell sf 1509685 Sep 23 15:51 /afs/slac/public/users/cottrell/umar.tar.gz
One can access the file from the web via ftp://ftp.slac.stanford.edu/users/cottrell
Maintaining Logs
Log4perl has been used to create logs and alert the administrators (currently kalim & cottrell) of any anomaly.
The logging process maintains the logs by using two appenders (sinks):
- The first appender is used to highlight critical errors -- as a result of these errors, the charts fail to appear. If such an error occurs an email describing the error is sent to the administrators.
- The second appender maintains detailed information while the charts are generated.
The configuration file for the logging process is located at:
| No Format |
|---|
/afs/slac/package/pinger/motion-chart/log.conf
|
The log itself is stored at:
| No Format |
|---|
/afs/slac/package/pinger/motion-chart/logs/motion_chart.log
|
The configuration file is described below:
| No Format |
|---|
# Define the root logger and the filters. Set the trigger level to INFO
log4perl.logger = INFO, AppInfo, AppError

# Filter to match level ERROR. Use this filter for the appender
# which sends emails about critical errors
log4perl.filter.MatchError = Log::Log4perl::Filter::LevelMatch
log4perl.filter.MatchError.LevelToMatch  = ERROR
log4perl.filter.MatchError.AcceptOnMatch = true

# Filter to match level INFO. Use this filter for the appender
# maintaining detailed logs.
log4perl.filter.MatchInfo  = Log::Log4perl::Filter::LevelMatch
log4perl.filter.MatchInfo.LevelToMatch  = INFO
log4perl.filter.MatchInfo.AcceptOnMatch = true

# Define the Error appender
log4perl.appender.AppError         = Log::Dispatch::Email::MailSend
log4perl.appender.AppError.to      = kalim@slac.stanford.edu, cottrell@slac.stanford.edu
log4perl.appender.AppError.subject = [Missing data in Motion Charts] see /afs/slac/package/pinger/motion-chart/logs/motion_chart.log
log4perl.appender.AppError.layout = \
    Log::Log4perl::Layout::PatternLayout
log4perl.appender.AppError.layout.ConversionPattern = %d %p (%L) %m %n
# Inform about critical errors only
log4perl.appender.AppError.Threshold = ERROR
# log4perl.appender.AppError.Filter   = MatchError

# Information appender
log4perl.appender.AppInfo = Log::Log4perl::Appender::File
log4perl.appender.AppInfo.filename    = logs/motion_chart.log
log4perl.appender.AppInfo.mode = write
log4perl.appender.AppInfo.layout = \
    Log::Log4perl::Layout::PatternLayout
log4perl.appender.AppInfo.layout.ConversionPattern = %d %p %L %m %n
# log4perl.appender.AppInfo.Filter   = MatchInfo
|
The log maintaining detailed information may grow to a large size. To avoid this problem I wrote a script which rotates the logs on daily basis while maintaining archives of the last five days.
The script is located at:
| No Format |
|---|
/afs/slac/package/pinger/motion-chart/logs/maintain-logs.pl
|
The archives at stored at:
| No Format |
|---|
/afs/slac/package/pinger/motion-chart/logs/archives/
|
The script maintain-logs is executed daily as a cron-job
Updates
July 2019
Updated several of the metrics, in particular the PingER metrics (minimum and average RTT, jitter, loss, unreachability, throughput), plus IDI, HDI, Penetration and Population. the following were not updated and hence terminate in 2010: DOI, CPI, Users.
October 2019
The frame for the chart was being displayed but with no contents.
Umar pointed out
Sat Oct 12 10:48:28 2019 create-motion-chart-pages.pl: finished, took 239 secs.
I followed the instructions for Enabling Flash in Chrome at https://support.digication.com/hc/en-us/articles/115003963468-Enabling-Flash-for-Google-Chrome-Windows-Macintosh-2.0.0 is installed in this browser
- Made sure Flash was enabled.
- According to https://www.whatismybrowser.com/detect/what-version-of-flash-is-installed I have version 32.0.0.
- Reloaded the web page: https://www-iepm.slac.stanford.edu/pinger/pinger-metrics-motion-chart.html.
Chrome No change.
- Viewed source and made sure change had taken effect
- Looked in Developer tools, noted the following which may be of interest
- pinger-metrics-motion-chart.html:51508 A parser-blocking, cross site (i.e. different eTLD+1) script, https://ssl.google-analytics.com/ga.js, is invoked via document.write. The network request for this script MAY be blocked by the browser in this or a future page load due to poor network connectivity. If blocked in this page load, it will be confirmed in a subsequent console message. See https://www.chromestatus.com/feature/5718547946799104 for more details.
- (anonymous) @ pinger-metrics-motion-chart.html:51508
- pinger-metrics-motion-chart.html:1 Cross-origin plugin content from must have a visible size larger than 400 x 300 pixels, or it will be blocked. Invisible content is always blocked.
Firefox No change
- Followed instructions at https://support.mozilla.org/en-US/kb/install-flash-plugin-view-videos-animations-games
- Agreed to license, manually downloaded latest Flash and completed installation
- Updated Firefox 69.0.1
- Restarted Firefox, enable Adobe Flash.
- Same result as Chrome
Umar pointed the problem was related to having no data for Normalized throughput. If one chooses another metric for the y axis default then the content is displayed.
Normalized throughput is automatically updated by prm.pl via trscrontab on pinger@pinger.slac.stanford.edu
Code Block pinger;1300 30 07 04 1 * /afs/slac.stanford.edu/package/pinger/prm/prm.pl -lp true -c /afs/slac.stanford.edu/package/pinger/prm/prm-allyearly-continent.conf #takes 11 mins on PingER 11/24/2012- Ran it manually to be sure and looked at the date updated: -rw-rw-rw- 1 pinger sf 1143 Oct 14 10:18 nthroughput-EDU.SLAC.STANFORD.PINGER-continent-allyearly.csv
- Reran create-motion-chart-pages.pl
- No change.
- Looked at the file https://www-iepm.slac.stanford.edu/pinger/prmout/nthroughput-EDU.SLAC.STANFORD.PINGER-continent-allmonthly.csv (created by prm.pl using the configuration file /afs/slac.stanford.edu/package/pinger/prm/prm-allyearly-continent.conf) and found it contained all periods ('.'). The configuration file looks OK. Reordered prm-allyearly-continent.conf and re-ran prm.pl. On the other hand the file https://www-iepm.slac.stanford.edu/pinger/prmout/throughput-EDU.SLAC.STANFORD.PINGER-country-allyearly.csv appears OK.
- Executing prm.pl with the above .conf file it appears data is available in for example https://www.slac.stanford.edu/cgi-bin/pingtable.pl?file=throughput&by=by-node&size=100&tick=allyearly&from=EDU.SLAC.STANFORD.PINGER&to=Africa&ex=none&only=all&ipv=all&dataset=hep&percentage=any, as well as for the equivalent files=minimum_rtt and file=packet_loss.
- Fixed missing single quotes (') in mon-lib.pl sub wget. Now https://www-iepm.slac.stanford.edu/pinger/prmout/nthroughput-EDU.SLAC.STANFORD.PINGER-continent-allyearly.csv has data.
- Look at source of pinger-metrics-motion-char.html, Normalized throughput is metric_index 4 in data.setValue(datapoint_index,metric_index,region), however it does not show up.
- Look at: /afs/slac/package/pinger/motion-chart/create-motion-chart-page.pl -r Europe -f EDU.SLAC.STANFORD.PINGER -t allyearly. The normalized throughput file is /afs/slac/g/www/www-iepm/pinger/prmout/nthroughput-EDU.SLAC.STANFORD.PINGER-country-allyearly.csv. However, this file (AKA https://www-iepm.slac.stanford.edu/pinger/prmout/nthroughput-EDU.SLAC.STANFORD.PINGER-country-allyearly.csv) has no data, e.g.
allyearly,?,1998,1999,2000,2001,2002,2003,2004,2005,2006,2007,2008,2009,2010,2011,2012,2013,2014,2015,2016,2017,2018,2019
EDU.SLAC.STANFORD.PINGER-to-Afghanistan,.,.,.,.,.,.,.,.,.,.,.,.,.,.,.,.,.,.,.,.,.,.,.,
EDU.SLAC.STANFORD.PINGER-to-Albania,.,.,.,.,.,.,.,.,.,.,.,.,.,.,.,.,.,.,.,.,.,.,.,
Re-ran /afs/slac.stanford.edu/package/pinger/prm/prm.pl -lp true -c /afs/slac.stanford.edu/package/pinger/prm/prm-allyearly-slac.conf to yield https://www-iepm.slac.stanford.edu/pinger/prmout/nthroughput-EDU.SLAC.STANFORD.PINGER-country-allyearly.csv AKA /afs/slac/g/www/www-iepm/pinger/prmout/nthroughput-EDU.SLAC.STANFORD.PINGER-country-allyearly.csv which has data in it.
- Reran ~cottrell/bin/create-motion-chart-pages.pl, still no Normalized throughput data in https://www-iepm.slac.stanford.edu/pinger/pinger-metrics-motion-chart.html
- There is data in /afs/slac/g/www/www-iepm/pinger/prmout/nthroughput-EDU.SLAC.STANFORD.PINGER-country-allyearly.csv AKA https://www-iepm.slac.stanford.edu/pinger/prmout/nthroughput-EDU.SLAC.STANFORD.PINGER-country-allyearly.csv
- Looking in /afs/slac/package/pinger/motion-chart/create-motion-chart-page.pl -r Europe -f EDU.SLAC.STANFORD.PINGER -t allyearly it opens (around line 968) the file /afs/slac/g/www/www-iepm/pinger/prmout/nthroughput-EDU.SLAC.STANFORD.PINGER-country-allyearly.csv and data is found there.
- Reran /afs/slac/package/pinger/motion-chart/create-motion-chart-pages.pl, still no Normalized throughput data there.
Normalized throughput is metric_index 4 in data.setValue(datapoint_index,metric_index,region). It is added around line 444 in /afs/slac/package/pinger/motion-chart/create-motion-chart-page.pl. Using perl -d /afs/slac/package/pinger/motion-chart/create-motion-chart-page.pl -r Europe -f EDU.SLAC.STANFORD.PINGER -t and halting at
Code Block 442: unless (!defined($data{"nthroughput"}->{$country}->{$interval})) { 443: if ( (($data{"nthroughput"}->{$country}->{$interval}) ne ".") 444 && (($data{"nthroughput"}->{$country}->{$interval}) ne "") 445 && (($data{"nthroughput"}->{$country}->{$interval}) != 0)){ 446: print OUTFILE " data.setValue($j, 4, " 447 . $data{"nthroughput"}->{$country}->{$interval} . ");\n"; 448 } 449 } DB<15> p "data.setValue($j, 4, $data{'nthroughput'}->{$country}->{$interval});\n" data.setValue(693, 4, 12240.9); And it is written to OUTFILE /afs/slac/g/www/www-iepm/pinger/pinger-metrics-motion-chart-Europe-EDU.SLAC.STANFORD.PINGER-allyearly.html Looking in /afs/slac/g/www/www-iepm/pinger/pinger-metrics-motion-chart-Europe-EDU.SLAC.STANFORD.PINGER-allyearly.html we see lines of the form: data.addRows(1); data.setValue(5, 0, 'Denmark'); data.setValue(5, 1, 1998); data.setValue(5, 2, 'Europe'); data.setValue(5, 3, 210.241); data.setValue(5, 4, 2919.71); #Note the metric_index=4, which is for nthroughput data.setValue(5, 16, 360.566) The metric_index of 4 is deduced from: var data = new google.visualization.DataTable(); data.addColumn('string', 'Country'); data.addColumn('number', 'Year'); data.addColumn('string', 'Region'); data.addColumn('number', 'Average RTT (ms)'); data.addColumn('number', 'Normalized Throughput (Kbps)'); data.addColumn('number', 'Population (#)'); Then we ran time /afs/slac/package/pinger/motion-chart/create-motion-chart-pages.pl It took 225 seconds. However when we look at /afs/slac/g/www/www-iepm/pinger/pinger-metrics-motion-chart.html we see: data.addRows(1); data.setValue(39, 0, 'Denmark'); data.setValue(39, 1, 1998); data.setValue(39, 2, 'Europe'); data.setValue(39, 3, 210.241); data.setValue(39, 16, 360.566) We also verified that /afs/slac/g/www/www-iepm/pinger/pinger-metrics-motion-chart-Europe-EDU.SLAC.STANFORD.PINGER-allyearly.html had not changed So the new data is not getting between create-motion-chart-page.pl to create-motion-chart-pages.pl Also: -bash-4.1$ ls -l /afs/slac/g/www/www-iepm/pinger/pinger-metrics-motion-chart-Europe-EDU.SLAC.STANFORD.PINGER-allyearly.html -rw-rw-r-- 1 pinger sf 465357 Oct 16 12:44 /afs/slac/g/www/www-iepm/pinger/pinger-metrics-motion-chart-Europe-EDU.SLAC.STANFORD.PINGER-allyearly.html Where as the file being displayed by bash-4.1$ ls -l /afs/slac/g/www/www-iepm/pinger/pinger-metrics-motion-chart.html lrwxr-xr-x 1 pinger sf 103 Jun 29 21:54 /afs/slac/g/www/www-iepm/pinger/pinger-metrics-motion-chart.html -> /afs/slac/g/www/www-iepm/pinger/pinger-metrics-motion-chart-all-EDU.SLAC.STANFORD.PINGER-allyearly.html -bash-4.1$ ls -l /afs/slac/g/www/www-iepm/pinger/pinger-metrics-motion-chart-all-EDU.SLAC.STANFORD.PINGER-allyearly.html -rw-rw-r-- 1 pinger sf 2152879 Oct 14 10:22 /afs/slac/g/www/www-iepm/pinger/pinger-metrics-motion-chart-all-EDU.SLAC.STANFORD.PINGER-allyearly.html Which is unexpected since I thought re-running create-motion-chart-pages.pl would have updated the above file to today (Oct 16). I am unclear what updated the file on Oct 14. The possible files are: bash-4.1$ ls -l /afs/slac/g/www/www-iepm/pinger/pinger-metrics-motion-chart*EDU*allyearly* -rw-rw-r-- 1 kalim sg 420174 Jun 29 18:17 /afs/slac/g/www/www-iepm/pinger/pinger-metrics-motion-chart-Africa-EDU.SLAC.STANFORD.N3-allyearly.html -rw-rw-r-- 1 pinger sf 588037 Oct 16 12:43 /afs/slac/g/www/www-iepm/pinger/pinger-metrics-motion-chart-Africa-EDU.SLAC.STANFORD.PINGER-allyearly.html -rw-rw-r-- 1 kalim sg 97918 Jun 29 18:17 /afs/slac/g/www/www-iepm/pinger/pinger-metrics-motion-chart-Balkans-EDU.SLAC.STANFORD.N3-allyearly.html -rw-rw-r-- 1 pinger sf 137858 Oct 16 12:43 /afs/slac/g/www/www-iepm/pinger/pinger-metrics-motion-chart-Balkans-EDU.SLAC.STANFORD.PINGER-allyearly.html -rw-rw-r-- 1 kalim sg 101016 Jun 29 18:17 /afs/slac/g/www/www-iepm/pinger/pinger-metrics-motion-chart-Central_Asia-EDU.SLAC.STANFORD.N3-allyearly.html -rw-rw-r-- 1 pinger sf 135565 Oct 16 12:44 /afs/slac/g/www/www-iepm/pinger/pinger-metrics-motion-chart-Central_Asia-EDU.SLAC.STANFORD.PINGER-allyearly.html -rw-rw-r-- 1 kalim sg 65743 Jun 29 18:18 /afs/slac/g/www/www-iepm/pinger/pinger-metrics-motion-chart-East_Asia-EDU.SLAC.STANFORD.N3-allyearly.html -rw-rw-r-- 1 pinger sf 73439 Oct 16 12:44 /afs/slac/g/www/www-iepm/pinger/pinger-metrics-motion-chart-East_Asia-EDU.SLAC.STANFORD.PINGER-allyearly.html -rw-rw-r-- 1 kalim sg 334304 Jun 29 18:18 /afs/slac/g/www/www-iepm/pinger/pinger-metrics-motion-chart-Europe-EDU.SLAC.STANFORD.N3-allyearly.html -rw-rw-r-- 1 pinger sf 465357 Oct 16 12:44 /afs/slac/g/www/www-iepm/pinger/pinger-metrics-motion-chart-Europe-EDU.SLAC.STANFORD.PINGER-allyearly.html -rw-rw-r-- 1 kalim sg 224179 Jun 29 18:18 /afs/slac/g/www/www-iepm/pinger/pinger-metrics-motion-chart-Latin_America-EDU.SLAC.STANFORD.N3-allyearly.html -rw-rw-r-- 1 pinger sf 310831 Oct 16 12:45 /afs/slac/g/www/www-iepm/pinger/pinger-metrics-motion-chart-Latin_America-EDU.SLAC.STANFORD.PINGER-allyearly.html -rw-rw-r-- 1 kalim sg 141526 Jun 29 18:18 /afs/slac/g/www/www-iepm/pinger/pinger-metrics-motion-chart-Middle_East-EDU.SLAC.STANFORD.N3-allyearly.html -rw-rw-r-- 1 pinger sf 209985 Oct 16 12:45 /afs/slac/g/www/www-iepm/pinger/pinger-metrics-motion-chart-Middle_East-EDU.SLAC.STANFORD.PINGER-allyearly.html -rw-rw-r-- 1 kalim sg 50387 Jun 29 18:18 /afs/slac/g/www/www-iepm/pinger/pinger-metrics-motion-chart-North_America-EDU.SLAC.STANFORD.N3-allyearly.html -rw-rw-r-- 1 pinger sf 66114 Oct 16 12:45 /afs/slac/g/www/www-iepm/pinger/pinger-metrics-motion-chart-North_America-EDU.SLAC.STANFORD.PINGER-allyearly.html -rw-rw-r-- 1 kalim sg 54170 Jun 29 18:19 /afs/slac/g/www/www-iepm/pinger/pinger-metrics-motion-chart-Oceania-EDU.SLAC.STANFORD.N3-allyearly.html -rw-rw-r-- 1 pinger sf 75277 Oct 16 12:46 /afs/slac/g/www/www-iepm/pinger/pinger-metrics-motion-chart-Oceania-EDU.SLAC.STANFORD.PINGER-allyearly.html -rw-rw-r-- 1 kalim sg 103053 Jun 29 18:19 /afs/slac/g/www/www-iepm/pinger/pinger-metrics-motion-chart-S.E._Asia-EDU.SLAC.STANFORD.N3-allyearly.html -rw-rw-r-- 1 pinger sf 149525 Oct 16 12:46 /afs/slac/g/www/www-iepm/pinger/pinger-metrics-motion-chart-S.E._Asia-EDU.SLAC.STANFORD.PINGER-allyearly.html -rw-rw-r-- 1 kalim sg 87208 Jun 29 18:19 /afs/slac/g/www/www-iepm/pinger/pinger-metrics-motion-chart-South_Asia-EDU.SLAC.STANFORD.N3-allyearly.html -rw-rw-r-- 1 pinger sf 123603 Oct 16 12:46 /afs/slac/g/www/www-iepm/pinger/pinger-metrics-motion-chart-South_Asia-EDU.SLAC.STANFORD.PINGER-allyearly.html -rw-rw-r-- 1 kalim sg 1588320 Jun 29 18:19 /afs/slac/g/www/www-iepm/pinger/pinger-metrics-motion-chart-all-EDU.SLAC.STANFORD.N3-allyearly.html -rw-rw-r-- 1 pinger sf 2152879 Oct 14 10:22 /afs/slac/g/www/www-iepm/pinger/pinger-metrics-motion-chart-all-EDU.SLAC.STANFORD.PINGER-allyearly.html lrwxr-xr-x 1 pinger sf 64 Jun 29 21:51 /afs/slac/g/www/www-iepm/pinger/pinger-metrics-motion-chart-all-EDU.SLAC.STANFORD.SLAC-allyearly.html -> /afs/slac/g/www/www-iepm/pinger/pinger-metrics-motion-chart.html Also below are the crontab entries: #Create the motion bubble plots, create-motion-chart-pages.pl takes ~ 4 mins: pinger;30 00 18 * * *
...
Maintaining Logs
Log4perl has been used to create logs and alert the administrators (currently kalim & cottrell) of any anomaly.
The logging process maintains the logs by using two appenders (sinks):
- The first appender is used to highlight critical errors -- as a result of these errors, the charts fail to appear. If such an error occurs an email describing the error is sent to the administrators.
- The second appender maintains detailed information while the charts are generated.
The configuration file for the logging process is located at:
| No Format |
|---|
/afs/slac/package/pinger/motion-chart/log.conf
|
The log itself is stored at:
| No Format |
|---|
/afs/slac/package/pinger/motion-chart/logs/motion_chart.log
|
The configuration file is described below:
| No Format |
|---|
# Define the root logger and the filters. Set the trigger level to INFO
log4perl.logger = INFO, AppInfo, AppError

# Filter to match level ERROR. Use this filter for the appender
# which sends emails about critical errors
log4perl.filter.MatchError = Log::Log4perl::Filter::LevelMatch
log4perl.filter.MatchError.LevelToMatch  = ERROR
log4perl.filter.MatchError.AcceptOnMatch = true

# Filter to match level INFO. Use this filter for the appender
# maintaining detailed logs.
log4perl.filter.MatchInfo  = Log::Log4perl::Filter::LevelMatch
log4perl.filter.MatchInfo.LevelToMatch  = INFO
log4perl.filter.MatchInfo.AcceptOnMatch = true

# Define the Error appender
log4perl.appender.AppError         = Log::Dispatch::Email::MailSend
log4perl.appender.AppError.to      = kalim@slac.stanford.edu, cottrell@slac.stanford.edu
log4perl.appender.AppError.subject = [Missing data in Motion Charts] see /afs/slac/package/pinger/motion-chart/logs/motion_chart.log
log4perl.appender.AppError.layout = \
    Log::Log4perl::Layout::PatternLayout
log4perl.appender.AppError.layout.ConversionPattern = %d %p (%L) %m %n
# Inform about critical errors only
log4perl.appender.AppError.Threshold = ERROR
# log4perl.appender.AppError.Filter   = MatchError

# Information appender
log4perl.appender.AppInfo = Log::Log4perl::Appender::File
log4perl.appender.AppInfo.filename    = logs/motion_chart.log
log4perl.appender.AppInfo.mode = write
log4perl.appender.AppInfo.layout = \
    Log::Log4perl::Layout::PatternLayout
log4perl.appender.AppInfo.layout.ConversionPattern = %d %p %L %m %n
# log4perl.appender.AppInfo.Filter   = MatchInfo
|
The log maintaining detailed information may grow to a large size. To avoid this problem I wrote a script which rotates the logs on daily basis while maintaining archives of the last five days.
The script is located at:
| No Format |
|---|
/afs/slac/package/pinger/motion-chart/logs/maintain-logs.pl
|
The archives at stored at:
...
/afs/slac/package/pinger/motion-chart/
...
The script maintain-logs is executed daily as a cron-job
...
create-motion-chart-pages.pl # Takes ~5 minutes
pinger;02 05 11 * * * /afs/slac/package/pinger/motion-chart/logs/manage-logs.pl -n 5
...
> /afs/slac/package/pinger/motion-chart/logs/log.stdout