| Table of Contents |
|---|
Introduction
This addresses the question of whether the PingER data can identify the impact of COVID-19 on the Internet. According to https://thrivenextgen.com/covid-19-impact-on-internet-performance/ Most Internet Service Providers (ISPs) oversubscribe their bandwidth and networks as typical inbound and outbound traffic are bursty and often don’t sustain high levels on a continuous basis. Fortunately, most of the larger National Providers have had sufficient time to prepare for the impact of COVID-19 and plan for the possibility of business workloads shifting to the home. Regardless of this capacity planning, Internet traffic patterns are about to change drastically based on schools across the country opting for virtual learning and business work from home migrations. Also, Time Magazine April 5/ April 15, 2020, reports that "traffic worldwide is up 35%...Demand is highest in the evening in the past two weeks, says networking firm Century Link."
For example, one might expect that as schools shut, people self-isolate, are sent home from, work from home, lockdowns are imposed etc., physical person-to-person communications would migrate to the Internet and will increase the use of the Internet e.g. by virtual learning, streaming. communicating, gathering information and entertaining for example. The thought is that this will lead to different Internet patterns and possibly lead to Internet congestion. A study of the impact of COVID-19 on Internet speeds by Ookla ("TRACKING COVID-19’S IMPACT ON GLOBAL INTERNET PERFORMANCE") is directly relevant, however, it is hard to identify any dramatic impact on the latencies in the report. There is also COVID-19 impacts on Internet traffic: Seattle, Northern Italy, and South Korea which looks at the impact on Internet traffic volumes. Also companies such as Netflix, Amazon, Apple, Disney, Google have reduced the quality of their videos to help reduce traffic and congestion of the Internet (see https://www.traffic-masters.net/covid19-web-traffic-statistics/).
PingER uses the ping facility to measure the Round Trip Time (RTT) between about 20 monitoring sites and target hosts in over 160 countries (over 10,000 pairs of monitor-remote(target)_sites). Every 30 minutes the monitor monitoring agent sends up to 30 pings at one-second intervals to each target until there are 10 responses, and records the data which are daily gathered, archived, analyzed and presented at the SLA C archiving site.
- A timeline for COVID-19 can be found here. Also looking at a map of how the COVID-19 traveled the world or the HealthMap one can see how and when various regions were impacted. Also see the Unacast interactive Social Distancing Scoreboard, updated daily, to empower organizations to measure and understand the efficacy of social distancing initiatives at the local level.
- Unacast is only for the US. It is broken down into States and counties. It uses cell phone location data to track locations. From this it derives for example distance traveled. An example of the information aggregated for the US is below (in the chart the bars are the new cases, the red dots are events, the state map colors are green for low mobility and dark orange for high mobility). Similar information is available state by state.

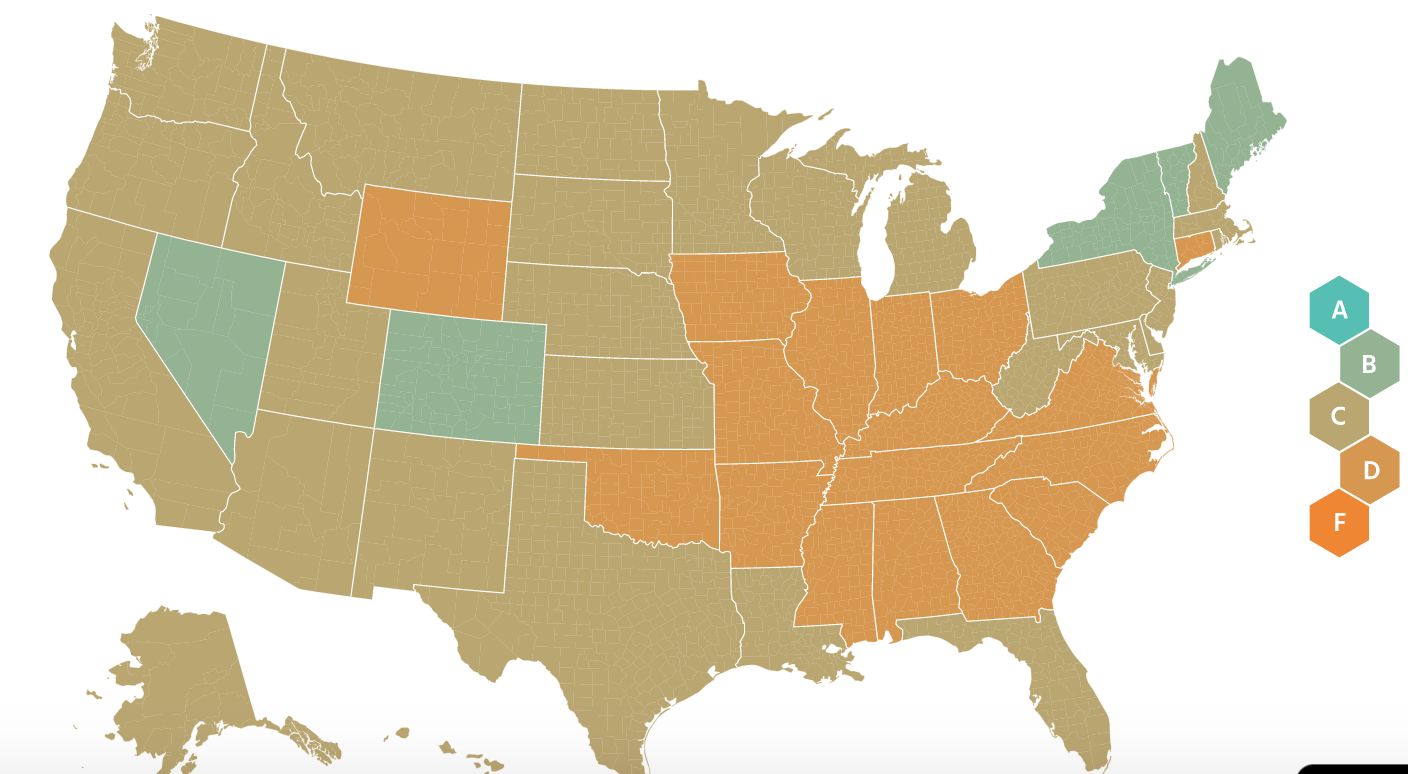
- Unacast is only for the US. It is broken down into States and counties. It uses cell phone location data to track locations. From this it derives for example distance traveled. An example of the information aggregated for the US is below (in the chart the bars are the new cases, the red dots are events, the state map colors are green for low mobility and dark orange for high mobility). Similar information is available state by state.
- For detailed statistics see:
- For the raw data, y:
- You can get up-to-date raw data on the coronavirus from Johns Hopkins from their GitHub site: https://github.com/CSSEGISandData/COVID-19. They have daily summaries and time-series data, both available as CSV files. You just have to browse around a bit to find what you want.
- To get down to the level of US states and counties see https://github.com/nytimes/covid-19-data
- For scientific modeling of the COVAD-19's impacts see:
- The Imperial College London reports on the Impact of non-pharmaceutical interventions (NPIs) to reduce COVID19 mortality and healthcare demand and Estimating the number of infections and the impact of non-pharmaceutical interventions on COVID-19 in 11 European countries.
- Projections for US hospital resources and deaths.
- For Interventions see
- For Intervention stringency vs cases see https://www.bsg.ox.ac.uk/sites/default/files/2020-04/BSG-WP-2020-031-v4.
...
Notes:
- For Europe, US and Canada the Christmas/New Year season (end November thru 2nd week in January) may also be expected to change behaviors, so comparing with data before the first cases (Nov-Jan) may be tricky.
- The measurements are from SLAC which shut down on March 17th, 2020, so the traffic on its links may have dramatically decreased after that.
- Utilization across networks and services has changed dramatically in terms of volumes, number of connections, utilization of links, interfaces, service endpoints. Most services are scaling up to handle the load. There are also many outages due to misconfiguration as people are trying to configure with configurations in production.
- The links from SLAC use the well-provisioned ESnet network and beyond that academic networks such as Internet2 in the US, GEANT in Europe, APAN in Asia, thus the measurements from SLAC may not be fully representative.
- Africa might be interesting since its networks tend to be less over-provisioned than those elsewhere. Also, see https://www.npr.org/sections/coronavirus-live-updates/2020/04/17/836896562/u-n-agency-fears-vulnerable-africa-may-suffer-at-least-300-000-covid-19-deaths
- Another possibility is South and Central America and the Carribean (AKA Latin America).
- Africa might be interesting since its networks tend to be less over-provisioned than those elsewhere. Also, see https://www.npr.org/sections/coronavirus-live-updates/2020/04/17/836896562/u-n-agency-fears-vulnerable-africa-may-suffer-at-least-300-000-covid-19-deaths
- Many of the targets are academic establishments that may have been closed, thus the target itself may be lightly loaded and so respond more quickly than in the past.
Milestones and Statistics
The milestones, for the virus itself, include 1st identified case, 1st hospitalization, 1st community case, 1st death.
...
- Social distancing encouraged
- Case-based measures
- School and college closures
- Public events banned
- Lockdown
- Interventions removed
Also, see See COVID 19 Internet Usage timeline for how companies have reduced their Internet traffic. Also see Akami sees 30 per cent surge in Internet traffic.
Statistics:
- Number of days to double cases
- Basic reproduction number R0 the average number of secondary infections produced by an infectious case where everyone is susceptible.
- For R >1 each individual infected by a transmissible disease is expected to infect a number of individuals that increase exponentially. For R< R<1, each case transmit transmits the disease to less than one individual and the disease dies out.
- Control reproductive number RC, the value of R in the presence of control measures.
- Incubation period
- Risk of importation
- Prpjections Projections on: all beds needed, ICU beds needed, invasive ventilators needed.
- 20% daily growth = cases or deaths double in < 4 days
Monitoring
The PingER monitor at SLAC, Stanford University in California currently monitors about 100 hosts in China. Using the pingtable.pl web page we selected daily aggregated data from SLAC to China for the last 365 days and looked at various metrics derived from the RTTs. Since many of the targets are Universities that may have taken lockdown measures and sent many students and staff home, we decided to look at the overall impact on SLAC to China pings. To do this we scroll down the pingtable.pl page to summary tables as shown below. 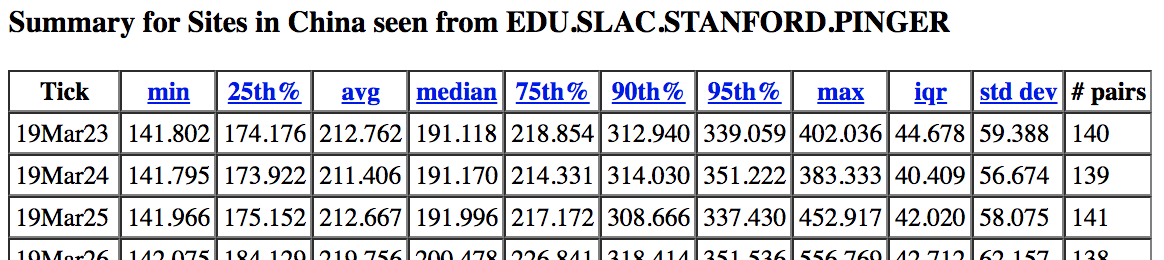
We can cut and paste this table into Excel to enable further analysis and visualization. Also the summary data is analyzed on a regular basis and the results made available as CSV files at https://www-iepm.slac.stanford.edu/pinger/prmout/. The file names (e.g.average_rtt-EDU.SLAC.STANFORD.PINGER-continent-allmonthly.csv) provide the metric (average_rtt in example), the Monitoring Agent (EDU-SLAC.STANFORD.PINGER in example), the region (continent or country) and the time window of each data point (or Tick, e.g. monthly (=last 12 months), allmonthly, or allyearly).
Using Motion Charts to look at PingER data by metric versus Covid cases
Examining using PingER metrics from pingtable.pl
Impact by region
China and North America
...
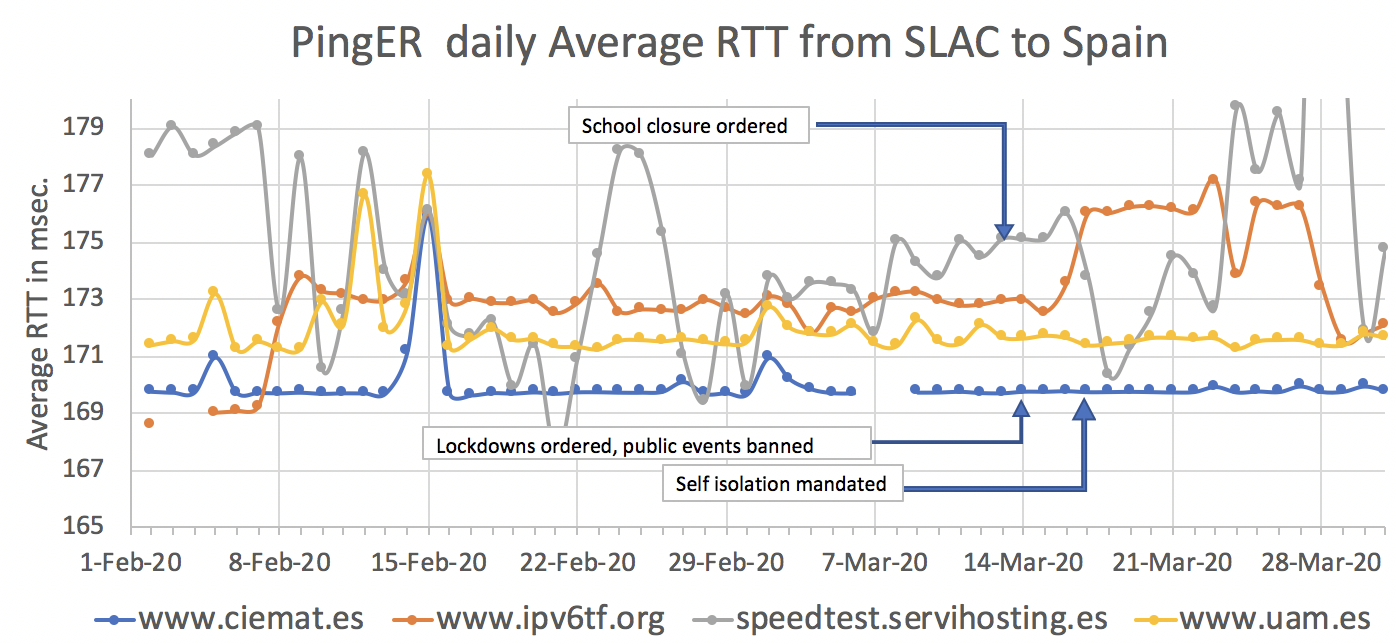
- Self isolation was mandated March 17
- Social distancing was encouraged March 9
- Public events were banned March 14
- School closure was ordered March 13
- Lockdown was ordered March 14.


More Information.
Timeline of COVID-19Models
- Imperial College reports:
- Covid-19 Projections Using Machine Learning for interventions in European, and some Asian countries.
- MIDAS Online portal for COVID-19 Modeling Research
Potential Long-term Intervention Strategies for COVID-19
Probably the best source of PingER data is https://www-iepm.slac.stanford.edu/pinger/prmout/ which is aggregated data for various metrics by region and time window (or tick).
Excel spreadsheets.
.
Unacast uses cell phone location data to get a measure of how people are social distancing.
Johns Hopkins University data on Covid-19 cases etc,
Wikipedia has a graphical timeline by country.
Timeline for Covid-19 Interventions by country.
How Severe Are Coronavirus Outbreaks Across the U.S.? Look Up Any Metro Area, from the New York Times
Impact of Covid-19 on Internet traffic:
- https://blog.cloudflare.com/covid-19-impacts-on-internet-traffic-seattle-italy-and-south-korea/, March 13, 2020.
- From Speedtest see :https://www.speedtest.net/insights/blog/tracking-covid-19-impact-global-internet-performance/#/, March 13, 2020
- https://www.linkedin.com/pulse/snapshot-impact-covid-19-internet-traffic-levels-europe-hern%25C3%25A1ndez/, March 16, 2020
- https://www.expresscomputer.in/news/covid-19-impact-internet-exchange-operator-de-cix-india-reports-massive-increase-in-data-traffic/52860/, April 11, 2020
- https://indianexpress.com/article/technology/tech-news-technology/coronavirus-internet-speeds-slow-netflix-hotstar-amazon-prime-youtube-reduce-streaming-quality-6331237/, March 27, 2020
- https://corporate.comcast.com/covid-19/network?utm_medium=social-p&utm_source=facebook&utm_content=corp_covid-19_priority_facebook_phl%2Fdc%2Fsf_tot_fb%2Fig-feed_1&utm_campaign
...