Introduction
This document is a case study on the inter-regional connectivity of Eastern Asia. The figure - Eastern Asia - depicts the countries considered to be part of East Asia. These are China, Japan, North Korea, South Korea, Mongolia and Taiwan.
...
Here we study the current capacity, infrastructure and opportunities that the users of these countries have to access the Internet. Followed by that we analyze the Internet performance as measured by the PingER project in comparison to the world and neighbouring countries. Later we compare the performance statistics to the Human Development Indices.
Current circumstances
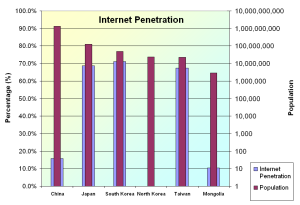
As shown in the following two figures, currently, Asia contributes approximately 40% of the Internet users towards the total. Among these 40%, the major contributors are some of the East Asian countries such as China, Japan, South Korea and Taiwan. (source: Internet World Stats)
...
This is primarily because of the high levels of Internet penetration compounded by the population. Also, the fact that these countries are densely populated, makes it easier for the telecommunication providers to extend services to large number of customers. Additionally the government policies promoting the establishment of a sound IT infrastructure has a positive impact. For example, by 2004 South Korea had spent approximately US$ 24 billion in setting up a national backbone linking government offices and public institutions. Also these same These policies have also encouraged competition among service providers resulting in decrease in the costs and increase in data rates. The summary is provided in Table 1 - Cost of Internet access.
...
| Cost | Data Rate | Type | Estimate |
|---|---|---|---|---|
China | US$ 10 - 20 | 1 Mbps | DSL | 2007 |
Japan | US$ 90 | 1 Gbps | FTTH | 2005 |
S. Korea | US$ 30 | 100 Mbps | ADSL FTTH | 2004 2007 |
On average East Asia has an Internet Penetration level of 46.74%. South Korea features the highest Internet penetration level of 71.2% with Japan and Taiwan following closely at 68.7% and 67.4%. The statistics are listed in the table below (table 2). The same is summarized in the figure - Summary of Internet Penetration. These statistics were gathered from Internet World Statistics.
...
|
Summary of |
|---|
International Bandwidth for East Asia
The international bandwidths for China, Japan, North Korea, South Korea, Mongolia and Taiwan are shown in the figure below - International bandwidth. The statistics have been collected from Mike Jenson 10/18/07 - International bandwidth by country, Internet World Stats and ITU. They clearly show two groups of countries; those which have reasonable available resources (such as Japan ~100 Gbps aggregate, South Korea ~ 50 Gbps, Taiwan and China ~100 Gbps aggregate) and those which are lagging far behind (such as Mongolia and North Korea). North Korea is not known to have public internet access in general. Also, information about Internet connectivity is unavailable, however, N. Korea is known to have an internet cafe maintained via a satellite connection.
...
The central projection of the Global Internet Map 2006 shows the international internet bandwidth and is scaled by capacity. The map also shows color-coded tags, indicating the number of internet hosts per 10,000 people. Each country is color-coded according to the extent of international internet bandwidth available. The maps of central projection and international bandwidth usage per country were prepared by TeleGeography.
PingER and Internet Performance
Pinger Coverage
| Include Page | ||||
|---|---|---|---|---|
|
The map - PingER coverage of Eastern Asia highlights the Monitoring (Red), Beacon (Blue) and Remote (green) sites in the region. The distribution of these nodes is shown in Table - 3 below.
...
| Monitoring | Beacon | Remote |
|---|---|---|---|
Japan | 1 | 1 | 9 |
China | 2 | 1 | 7 (east) |
South Korea | 1 | 1 | 4 |
Mongolia | 0 | 1 | 0 |
Taiwan | 1 | 1 | 0 |
North Korea | 0 | 0 | 0 |
Worldwide Comparison
| Include Page | ||||
|---|---|---|---|---|
|
MOS for various Regions
| Include Page | ||||
|---|---|---|---|---|
|
Information on Calculation MOS can be found here.
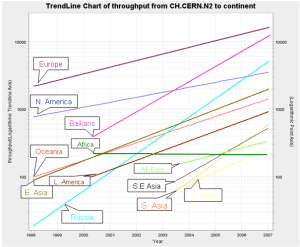
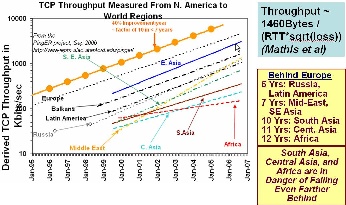
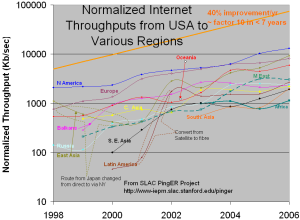
TCP throughput from CERN & SLAC to World Regions
| | |
Throughput trends as | TCP throughput as seen | Normalized Internet throughput |
|---|
...
It is important to look at the aggregated statistics mentioned above in the light of International bandwidth possessed by the East Asian countries as shown below.
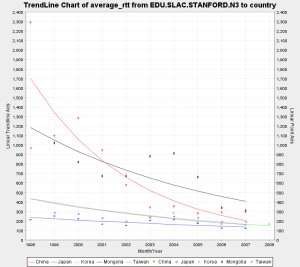
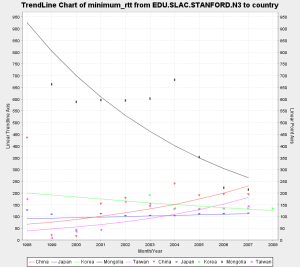
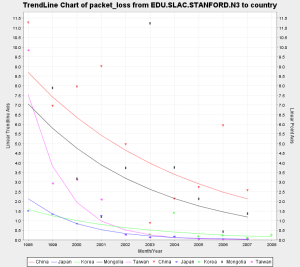
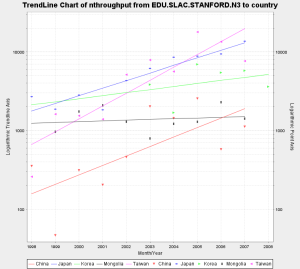
Packet Loss, Minimum RTT and Throughput
| | | |
Average RTT (as seen | Minimum RTT (as seen | Packet Loss (as seen | Throughput (as seen |
|---|
...
|
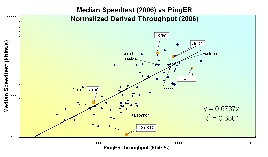
Median Speedtest vs PingER |
|---|
Routing
For the sake of reference, the figure below shows major international traffic routes and the submarine cable map. Domestic routes are omitted. The source is TeleGeography research.
...
We have at least one monitoring node in South Korea, Japan, China and Taiwan. With the help of those, we gathered the traceroute results for the neighbours as well as the world neighbouring countries as shown in the figures below.
| | | |
Routes to neighbours | Routes to neighbours | Routes to neighbours | Routes to neighbours |
|---|

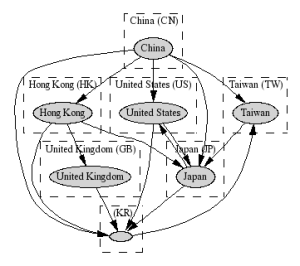
The trace route results traceroute results (annotated, raw) originating from China show that generally China is directly connected with its neighbouring countries. The exceptional cases are that of the links with Vietnam and Thailand. In case of Vietnam, the traffic is routed via United Kingdom and Hong Kong, where as in case of Thailand, the traffic flows either via Hong Kong and Japan or directly.China to China: Direct
China to Japan: China-> Japanto its neighbours i.e. Taiwan (#5, 61 ms), South Korea (#27, 73 ms) and Japan (#8, 100 ms) and the traffic generally takes the direct routes. However some results show that traffic destined for selected nodes in South Korea is either routed via Japan (#7, 114 ms) or Japan and US (#16, 209 ms) or Hong Kong and United Kingdom (#54). Similarly, for selected destinations in Japan the traffic is routed via Hong Kong (#24, 206 ms) or Taiwan (#25, >90 ms). Also, traffic for selected nodes in Taiwan is sometimes directed via South Korea (#27, 245 ms). On the other hand when the destination is within China, the traffic stays within China which is what one would expect. Random tests to other countries in the Asia showed traffic flowing as expected (i.e. as per the submarine links). However the results below were interesting. The RTT values encouraged us to conclude that traffic was indeed traversing these links.
China to Thailand: China->Hong Kong->Japan->Thailand OR China -> Thailand
China to IndonesiaVietnam: China-> Indonesia>Hong Kong-> United Kingdom->Hong Kong-> Vietnam
China to Singapore: China ->Hong Kong->Japan->Singapore
China to Malaysia: China->Hong Kong->Malaysia China to Korea: China-> Korea
China to Vietnam: China->Hong Kong-> United Kingdom->Hong Kong-> Vietnam
Looking at the trace routes from Japan to its neighbours, it is observed that traffic either flows directly or via United States, unlike China where most of the traffic to the same countries flowed via Hong Kong.
Japan to Japan: Direct
Japan to China: Japan -> United States (New York) ->Hong Kong -> China OR Japan->China
Japan to Vietnam: Japan -> Vietnam
Japan to Korea: Japan -> United States(Colorado) -> Korea_ _
Japan to Thailand: Japan -> United States(New York) -> Canada -> Thailand
Japan to Malaysia: Japan -> United States(Colorado) -> Malaysia
Japan to Singapore: Japan -> Singapore
The trace routes from South Korea to its neighbours show interesting results. Despite the fact that countries such as Vietnam, Philippines, Singapore, Thailand are in the vicinity, the traffic flows via United States, Germany and Canada unlike the case of Japan or China where the traffic mostly flows via Hong Kong.
Korea to Korea: Direct
Korea to China: Korea -> United States->Hong Kong OR Korea -> China
Korea to Thailand: Korea ->United States (Colorado -> Canada (Quebec) ->Thailand
Korea to Singapore: Korea -> United States(Colorado) -> Singapore
Korea to Japan: Korea -> Japan
Korea to Philippines: Korea -> Germany->Hong Kong->Philippines
Korea to Vietnam: Korea -> United Kingdom-> Hong Kong -> Vietnam
Taiwan to China: Taiwan -> China
Taiwan to Korea: Taiwan -> United States -> Japan -> Korea
Comparison with Human Development Indices
There are many indicators of countries' development from organizations such as the International Telecommunications Union, the United Nations, the CIA, the World Bank try to classify countries by their development. They are quite challenging and require careful consideration of: what can be measured, how useful is it, how well it is defined, how it changes with time, how it changes from country to country, the cost of measuring, the time it takes to gather (to avoid being too out of date, how subjective they are etc.
Typically they are based on some combination of GDP, life expectancy, literacy, education, phone lines, Internet penetration etc. Some examples include the Human Development Index (HDI), the Digital Opportunity Index (DOI), the Opportunity Index, the Technology Achievement Index etc. In general agree with one another (R 2 ~ 0.8). More information can be found here. For this report we focus on just two, the DOI (since it is recent and covers more countries than most) and the HDI since it different from the others and focuses on the human condition.
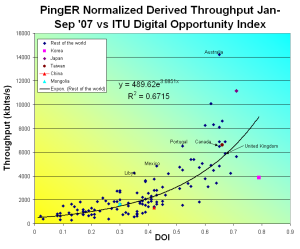
The Digital Opportunity Index (DOI) measures countries' ICT capabilities in infrastructure, access path and device, affordability and coverage, and quality. It covers 180 countries, and has recent (data 2005, announced in 2006). There are 11 indicators: that cover mobile telephony coverage, Internet tariffs, #computers, fixed line phones, mobile subscribers, Internet users all in relation to the population of the country. A figure of the correlation with the normalized derived PingER throughput is shown below. The correlation is fairly good. Again nearly all countries show significantly high values of throughput in comparison to DOI except for the case of Mongolia and China.
|
ITU DOI vs |
|---|
"The Human Development Index (HDI) is the measure of life expectancy, literacy, education, and standard of living for countries worldwide. It is a standard means of measuring well-being, especially child welfare. It is used to determine and indicate whether a country is a developed, developing, or underdeveloped country and also to measure the impact of economic policies on quality of life." from Wikipedia.
| |
UNDP HDI vs | GDP/capita vs |
|---|
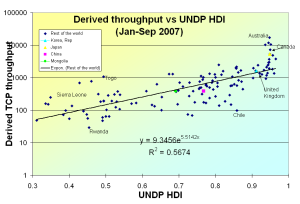
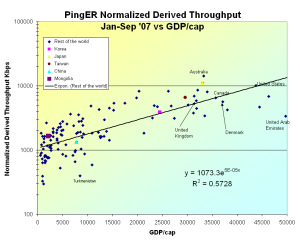
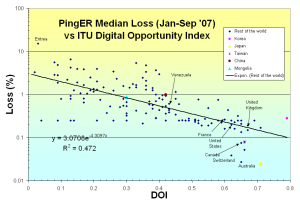
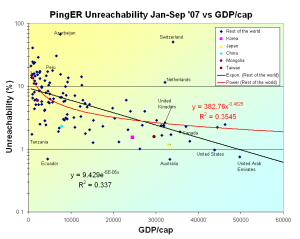
The figure above shows the correlation between the HDI and the normalized derived PingER throughput for the world and East Asian countries, and the PingER throughputs per East Asian country. The correlation is seen to be strong (R 2~ 0.56). It is also seen that except for Mongolia, all East Asian countries feature equally high throughput as compared to the HDI. Also, all conform to the trend maintained by the countries in general. Additionally, a comparison of loss percentage (as seen from the US) to DOI and Purchasing Power Parity (GDP/capita) to Unreachability confirms that nearly all the East Asian countries perform well and perform equal well or better than other leading countries such as Australia, Canada, United Kingdom, France etc.
| |
ITU DOI vs loss % as | GDP/capita vs Unreachability |
|---|
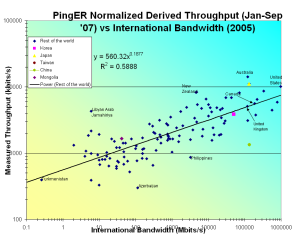
Below, the figure on the left shows the correlation between International bandwidth (as discussed earlier) and the normalized derived PingER throughput. A good correlation (R 2 ~ 0.59) is observed between the two. It is also seen that the East Asian countries (highlighted) lie towards the top right where both the throughput and International Bandwidth are high and match with the results of countries known to have good network infrastructures. On the other hand Mongolia is an anomaly. This can be attributed to the relatively low international bandwidth and resources available per user. The loss percentages are quite prominent as well (as discussed earlier). Also, the poor RTTs (due to delays in the last few hops) contribute towards significantly low throughput values.
|
International bandwidth (2005) |
|---|
Conclusions
(The conclusions may not be in the order of importance)
...
- Results as seen internationally are strongly influenced by the condition of the network within the country.
- This was confirmed by the step changes seen in performance in 2005/2006 when an Internet Exchange Router was setup connecting the ISPs of Mongolia.
- Nearly all results are skewed by the performance observed for the last few hops.
...
- This is evident from the strong correlation of these parameters with Internet performance metrics as observed by PingER. In the case of East Asia, Japan, South Korea and Taiwan show good Internet performance results while maintaining high values for HDI. On the other hand, Mongolia shows average (and in some cases below average) Internet performance statistics while maintaining average HDI values.
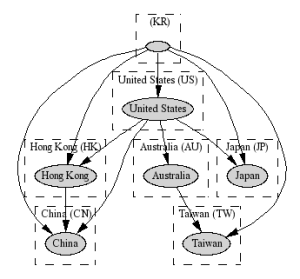
The results (annotated, raw) from South Korea show that Korea is directly connected to Japan (#1, 36 ms), Taiwan (#6, 214 ms), China (#11, 110 ms) and the US and the traffic generally takes the direct routes. However some results show that traffic destined for selected nodes in Japan is directed via the US (#23, 182 ms). Similarly, traffic destined for particular nodes in Taiwan is sometimes routed via the US and Australia (#2, >272 ms) and the traffic destined for specific nodes in China is sometimes routed via Hong Kong (#80, 97 ms). Lastly the traffic destined within Korea is observed to stay within Korea as one would expect. Random tests to countries in the Asia showed traffic flowing as expected (i.e. as per the submarine links). However the results below were interesting. The RTT values encouraged us to conclude that traffic was indeed traversing these links.
Korea to Thailand: Korea ->United States -> Canada ->Thailand
Korea to Vietnam: Korea -> United Kingdom-> Hong Kong -> Vietnam
Korea to Singapore: Korea -> United States -> Singapore
Korea to Philippines: Korea -> Germany->Hong Kong->Philippines
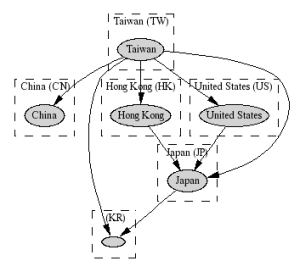
The traceroute results (annotated, raw) originating from Taiwan show that Taiwan is directly connected to its neighbours Japan (#1, 34 ms), China (#17, 61 ms), Korea (#7, 45ms), Hong Kong (#63, >30 ms) as well as the United States and the traffic generally takes the direct routes. However in some cases the results show that traffic destined for selected nodes in Japan is routed via the US (#23, >140ms) or Hong Kong (#74, 73ms). Also, the traffic destined for particular nodes in South Korea is sometimes routed via Japan (#18, >65 ms). As one would expect, the traffic destined for a node within Taiwan stays within Taiwan.
Interestingly though, the traceroute results (annotated, raw) show that Japan is directly connected to its neighbours i.e. Taiwan (#4, 34ms), Korea (#13, 40ms), China (#14, 130 ms) and nearly all the traffic to destinations in neighbouring countries is routed via the direct links. In very few cases the traffic destined for selected nodes in Korea is routed via the US (#28, 252 ms). Similarly traffic destined for selected nodes in China is routed via the US (#16, 219 ms). Random tests to countries in the Asia showed traffic flowing as expected (i.e. as per the submarine links). However the results below were interesting. The RTT values encouraged us to conclude that traffic was indeed traversing these links. It is worth noting that traffic destined for Vietnam from both China and Korea is routed via the US, when Japan is directly connected.
Japan to Thailand: Japan -> United States -> Canada -> Thailand
Japan to Vietnam: Japan -> Vietnam
Japan to Singapore: Japan -> Singapore
Japan to Malaysia: Japan -> United States -> Malaysia
The anomalous behaviour of traffic to selected nodes/networks may be attributed to the BGP policies enforced by ISPs.
Comparison with Human Development Indices
There are many indicators of countries' development from organizations such as the International Telecommunications Union, the United Nations, the CIA, the World Bank try to classify countries by their development. They are quite challenging and require careful consideration of: what can be measured, how useful is it, how well it is defined, how it changes with time, how it changes from country to country, the cost of measuring, the time it takes to gather (to avoid being too out of date, how subjective they are etc.
Typically they are based on some combination of GDP, life expectancy, literacy, education, phone lines, Internet penetration etc. Some examples include the Human Development Index (HDI), the Digital Opportunity Index (DOI), the Opportunity Index, the Technology Achievement Index etc. In general agree with one another (R 2 ~ 0.8). More information can be found here. For this report we focus on just two, the DOI (since it is recent and covers more countries than most) and the HDI since it different from the others and focuses on the human condition.
The Digital Opportunity Index (DOI) measures countries' ICT capabilities in infrastructure, access path and device, affordability and coverage, and quality. It covers 180 countries, and has recent (data 2005, announced in 2006). There are 11 indicators: that cover mobile telephony coverage, Internet tariffs, #computers, fixed line phones, mobile subscribers, Internet users all in relation to the population of the country. A figure of the correlation with the normalized derived PingER throughput is shown below. The correlation is fairly good. Again nearly all countries show significantly high values of throughput in comparison to DOI except for the case of Mongolia and China.
|
ITU DOI vs |
|---|
"The Human Development Index (HDI) is the measure of life expectancy, literacy, education, and standard of living for countries worldwide. It is a standard means of measuring well-being, especially child welfare. It is used to determine and indicate whether a country is a developed, developing, or underdeveloped country and also to measure the impact of economic policies on quality of life." from Wikipedia.
| |
UNDP HDI vs | GDP/capita vs |
|---|
The figure above shows the correlation between the HDI and the normalized derived PingER throughput for the world and East Asian countries, and the PingER throughputs per East Asian country. The correlation is seen to be strong (R 2~ 0.56). It is also seen that except for Mongolia, all East Asian countries feature equally high throughput as compared to the HDI. Also, all conform to the trend maintained by the countries in general. Additionally, a comparison of loss percentage (as seen from the US) to DOI and Purchasing Power Parity (GDP/capita) to Unreachability confirms that nearly all the East Asian countries perform well and perform equal well or better than other leading countries such as Australia, Canada, United Kingdom, France etc.
| |
ITU DOI vs loss % as | GDP/capita vs Unreachability |
|---|
Below, the figure on the left shows the correlation between International bandwidth (as discussed earlier) and the normalized derived PingER throughput. A good correlation (R 2 ~ 0.59) is observed between the two. It is also seen that the East Asian countries (highlighted) lie towards the top right where both the throughput and International Bandwidth are high and match with the results of countries known to have good network infrastructures. On the other hand Mongolia is an anomaly. This can be attributed to the relatively low international bandwidth and resources available per user. The loss percentages are quite prominent as well (as discussed earlier). Also, the poor RTTs (due to delays in the last few hops) contribute towards significantly low throughput values.
|
International bandwidth (2005) |
|---|
Conclusions
(The conclusions may not be in the order of importance)
- Except for Mongolia - which shows average results - all East Asian countries show good (or acceptable) Internet performance. The trends show that these results are continuing to improve.
- Results as seen internationally are strongly influenced by the condition of the network within the country.
- This was confirmed by the step changes seen in performance in 2005/2006 when an Internet Exchange Router was setup connecting the ISPs of Mongolia.
- Nearly all results are skewed by the performance observed for the last few hops.
- Results as seen internationally are strongly influenced by the condition of the network within the country.
- Improvements (/changes) in the national backbones - as in the case of Mongolia in 2005 - result in step changes in Internet performance.
- Internet performance is closely tied with Human Development Indices - HDI.
- This is evident from the strong correlation of these parameters with Internet performance metrics as observed by PingER. In the case of East Asia, Japan, South Korea and Taiwan show good Internet performance results while maintaining high values for HDI. On the other hand, Mongolia shows average (and in some cases below average) Internet performance statistics while maintaining average HDI values.
- Generally the traffic is routed via optimal links. However, traffic for some destinations are routed indirectly even though shorter paths exist (which are used for traffic in general). This may be attributed to the BGP policies defined by the ISPs.
- Increase in PingER coverage results in accurate results. This is observed by the increased correlation of PingER results with Human Development Indices over the years 2006 and 2007.
Acknowledgements
We are grateful to all our collaborative partners in East Asia maintaining monitoring nodes which enabled us to conduct this study. The contact persons are Henry Wong (Dept. of Comp. Sci. and Eng., Hong Kong Univ. of Sci. and Tech.), C. S. Hong and Obaid Amin (Kyung Hee University, South Korea), Chen Hesheng (Institute of High Energy Physics Chinese Academy of Sciences, China), Trey (National Center for High Performance Computing, Taiwan), Takashi Ichihara (Institute of Physical and Chemical Research, Japan)
...
.