...
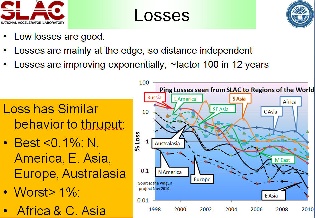
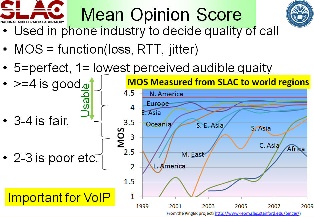
One can get an idea of how far behind Africa is compared to the rest of the world by comparing the PingER Internet throughputs, losses and Mean Opinion Scores (MOS).
Throughput | Losses | Mean Opinion Score (MOS) |
|---|---|---|
| | |
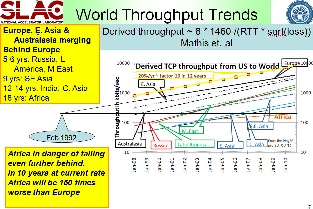
Minimum RTTs of <~ 400ms are typically a signature of a geostationary link. Looking at the minimum RTTs to African countries and comparing 2009 with 2010 one can see the impact of the new fibre/terestrial routes in particular for East Africa in the apparent reduction of minimum RTTs below 400ms for several countries.
...
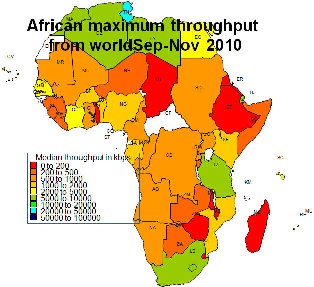
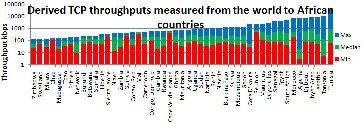
The derived throughputs measured from monitors around the world to African countries for September to November 2010 is shown below. The map shows the maximum of the average monthly derived TCP throughput for the hosts in the country. We chose the hosts with the maximum throughput since these are typically at the academic and research sites in the country and represent the best available internet connection in the country. The differences in the minimum median and maximum average monthly throughputs for hosts in each country are also shown sorted by maximum throughput. A spreadsheet is available.
|
|
|---|---|
| |
BGP Prefixes
...