...
Changes
*
System Test Plots
These are from the AllGammaOverlay test.
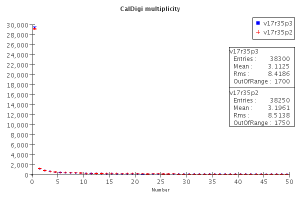
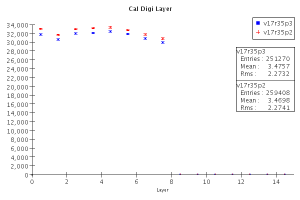
Although more events now have CAL hits (p3:38300 vs p2:38250, 40000 events were simulated), there are overall less total hits in the CAL.
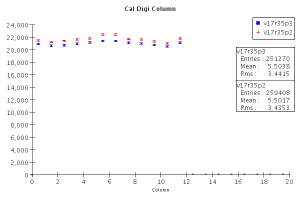
CAL Multiplicity | CAL digis by column |
|---|---|
|
|
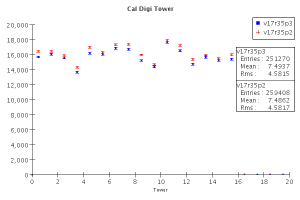
CAL digis by tower | CAL digis by layer |
|
|
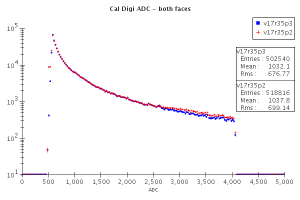
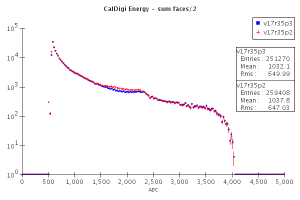
CAL ADC | CAL digi energy average |
|---|---|
|
|
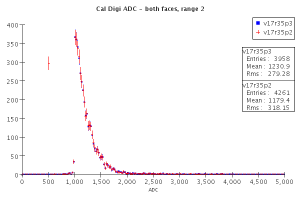
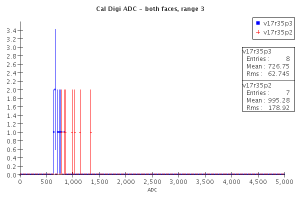
CAL ADC range 2 (both faces) | CAL ADC range 3 |
| |
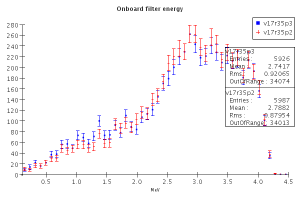
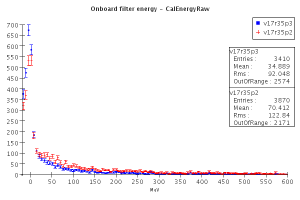
OBF filter energy | Filter Energy - CalEnergyRaw |
|
|
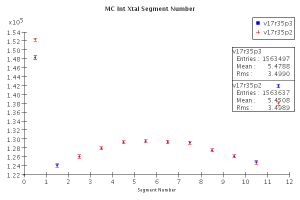
After looking through the CAL Overlay problem description, I realized I should have pulled the integrating hits plot. The fix handles assigning overlay energy deposits to the proper volume element for being included in the energy calculation. I expect an increase in the ends and so it is weird that one end is increasing and the other decreasing relative to the previous version.
CAL Integrating Segments |
|---|
|