...
Going to http://www-wanmon.slac.stanford.edu/cgi-wrap/connectivity.pl?format=csv&rawdata=pinger.usindh.edu.pk&days=6&monitor=pinger.pern.edu.pk and http://www-wanmon.slac.stanford.edu/cgi-wrap/connectivity.pl?format=csv&rawdata=pingerjms.pern.edu.pk&days=6&monitor=pinger.pern.edu.pk we collected the data for past 7 days and plotted it in excel to see the curves for Average RTT and Min RTT.
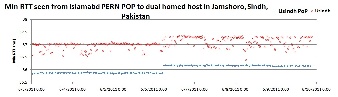
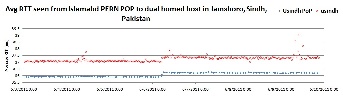
Min RTT from Pern Islamabad | Average RTT from Pern Islamabad |
|---|---|
| |
Looking at the graphs one can see that there are rapid fluctuations in the data values for each node. Because of which the graphs show a scattered plot with a number of data points above and below, which seem to be on the same point on x-axis. However looking at the spreadsheet, it is observed that two data values are collected for each half an hour, and these two values fluctuate by about 0.3 ~ 0.4 ms for PoP node while it fluctuates by 0.63ms for usndh non-PoP node. Although we don't know the reason for this fluctuation , however we know that this fluctuation is continuous for both of the nodes and for all 7 of the days.
We see that the min of min RTT for PoP was 35.827ms , avg of min RTT was 36.16402, max of min RTT was 36.48203, IQR of min RTT was 0.294 (see table for pingerjms.pern.edu.pk column 1 and 2).
pingerjms.pern.edu.pk | Min RTT (ms) | Avg RTT (ms) | Max RTT (ms) |
|---|---|---|---|
Min | 35.827 | 35.879 | 35.91 |
Avg | 36.164 02 | 36.21 07 | 36.29 16 |
Max | 36.48 203 | 36.623 293 | 37 36.934 711 |
Median | 36.159 131 | 36.201 174 | 36.264 224 |
IQR | 0.294 | 0.285 295 | 0.296 293 |
Similarly, we have the min, avg, max, median and IQR for Min RTT, Average RTT and Max RTT for the usindh node in the table shown below.
pinger.usindh.edu.pk | Min RTT (ms) | Avg RTT (ms) | Max RTT (ms) |
|---|---|---|---|
Min | 36.388 | 36.973 | 37.057 |
Avg | 37.34 04 | 37.54 23 | 37.84 511 |
Max | 37.967 352 | 39.472 032 | 46 44.352 613 |
Median | 37.311 023 | 37.614 252 | 37.711 381 |
IQR | 0.609 271 | 0.622 27 | 0.619 332 |
These tables can also be viewed in the spreadsheet attached above attached.
On average there is a difference of 1.2ms 02ms in Min RTT, 1.33ms 16ms in Average RTT and 1.55ms 35ms in Max RTT for the two nodes. Usindh PoP is performing better than Usindh non-PoP node.
Another interesting information is that for PoP node, difference in min of min RTT for 1000 bytes and 100 bytes of data is 0.287ms. This means that 900 bytes of data take a min RTT of 0.287ms to reach PoP usindh. This makes the bottleneck capacity to be 25.087Mbps. On the other hand for usindh non-PoP node, difference in min of min RTT for 1000 bytes and 100 bytes of data is 0.638ms. This means that 900 bytes of data take a min RTT of 0.638ms to reach PoP usindh. This makes the bottleneck capacity to be 11.285 Mbps.
Traceroute Results from pinger.pern.edu.pk
...
Extra hops can be seen in Usindh traceroute (hop 6 and 7). For both of the nodes, it takes 36.105 ~ 36.4 ms to reach the hop khi77.pie.net.pk, however, as the hops are increased for accessing usindh , an increased RTT of 0.9 ms is observed. This is a small difference in RTT for the two nodes which is added due to two extra hops and it supports the results shown above in graphs.
It is observed that a bimodal pattern is seen in min RTT, that is for Pern POP min RTT was 35.87 ms till 6th of june and then it increased to 36.16 ms. Similar is the case for non PoP usindh node. However when we compared the traceroutes on 5th June and 8th June, it was found that there weren't any additional hops. The increase in min RTT was due to the hops of rwp44.pie.net.pk and khi77.pie.net.pk showing increased RTT. See below the traceroute results for 5th June from Pern PoP Islamabad to Pern PoP Jamshoro
| Code Block |
|---|
Executing exec(traceroute, -m 30 -q 3 -f 3, 121.52.155.62, 140)
traceroute to 121.52.155.62 (121.52.155.62), 30 hops max, 140 byte packets
 4  rwp44.pie.net.pk (221.120.251.58)  35.475 ms  35.443 ms  35.426 ms
 5  khi77.pie.net.pk (221.120.205.70)  36.104 ms  36.332 ms  36.394 ms
 6  172.31.253.66 (172.31.253.66)  36.084 ms  36.184 ms  36.238 ms
 7  usindh.edu.pk (121.52.156.130)  36.701 ms  36.821 ms  36.757 ms
 8   (121.52.155.62)  37.273 ms !X  37.258 ms !X  37.244 ms !X
|
And the traceroute results on 8th June were as below:
| Code Block |
|---|
Executing exec(traceroute, -m 30 -q 3 -f 3, 121.52.155.62, 140)
traceroute to 121.52.155.62 (121.52.155.62), 30 hops max, 140 byte packets
 4  rwp44.pie.net.pk (221.120.251.58)  35.770 ms  35.710 ms  35.721 ms
 5  khi77.pie.net.pk (221.120.205.70)  41.929 ms  41.979 ms  42.033 ms
 6  172.31.253.66 (172.31.253.66)  36.404 ms  36.572 ms  36.593 ms
 7  usindh.edu.pk (121.52.156.130)  36.901 ms  37.043 ms  36.959 ms
 8   (121.52.155.62)  37.442 ms !X  37.427 ms !X  37.411 ms !X
|
A slight increase in RTT is seen for the two above mentioned hops. So far we are unable to find out the reason for this increase in RTT for these two hops. A similar increase in RTT is seen for the same two hops for the non PoP node (pinger.usindh.edu.pk) as well.
Comparison of Khi-PoP and
...
NEDUET
As the results of jamshoro and university of sindh do not go with the theoretical analysis, we tried to find out the performance of other PoPs as compared to one other pern node in the same city.
...
Now we want to confirm it by checking some other POP and non POP pair.
Comparison of Islamabad-PoP and NCP
We now tried to compare the average RTT from Pakistan to PERN POP Islamabad and to NCP (National College of Physics, Islamabad).
...
The results are not enough to reach a conclusion so we decided to make yet another comparison on a POP - Non PoP pair.
Comparison of Quetta-PoP and UOB
We here compared quetta POP and Non PoP.
...