We are interested in alternative ways of actively measuring the throughputs for countries of the world especially for developing countries. Part of this is to compare the results from direct measurements of throughput with those obtained from the PingER derived throughputs. We therefore contacted Ookla There are several active end-to-end throughput measurement web sites available today including Cnet, ZDNet.UK, ZDnet.AU, Ookla, NDT servers, NPAD servers, A Beltronica Telecom, Speakeasy. Of these NDT and NPAD are mainly diagnostic tools. NDT, NPAD, CNet and Speakeasy have servers in the US only, ZDNet.AU servers in Australia only, though it does not say we suspect ZDNet.UK probably has servers in the UK only. A Beltronica lists about 80 countries four of which are in Africa. We could find publicly accessible archives of results from only ZDNet.AU which we have analyzed elsewhere. Ookla solicited input so we contacted them by email on November 27, 2007 and to see if we could get more complete data from their archives. Mike Apgar and Doug Suttles of Ookla were kind enough to reply, answer questions, and on December 6, 2007 provide data suitable for importing into Excel (CSV format) and analyzing.
...
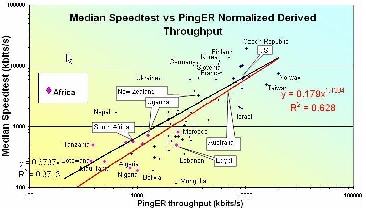
The results from Ookla are mainly oriented to broadband access for the residence and the performance of the local broadband providing ISP. The measurements are made at irregular intervals as determined by the whims of the client. The clients are self selected. Ookla also measures the true throughput separately in both the up- and downstream directions. PingER on the other hand is more oriented to measurements beween academic and research sites, the measurements are made at regular intervals (every 30 minutes) and the clients are selected by the server administrators. PingER also derives the throughput from its RTT and loss measurements using the Mathis formula (TCP throughput ~ 1460*8/(RTT*sqrt(loss)) where the result is in kbits/s if the RTT is in milliseconds. Thus the measurement is an average of the up and downstream directions. Though the Mathis formula is for classic versions of TCP's (e.g. New Reno) congestion control as used in most off the shelf computers today, it assumes TCP loss (and TCP provokes loss to detect congestion) whereas PingER gets the loss from pings and thus only samples loss. For these reasons and others PingER is only a rough estimate of throughput. The relationship between RTT, loss and throughput is seen here.
Our Ookla data has about 19 million IP client addresses. It is unclear how many times a given client makes a measurement or if it uses different servers from the default. PingER has about 1900 monitoring host (server) remote host (client) pairs each measured regularly every 30 minutes, or about 3 million measurements (where a single measurement is of 10 pings) per month.
...
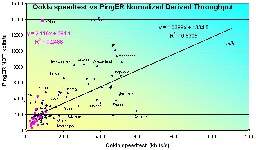
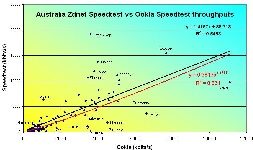
PingER NDT vs. Ookla speedtest transfer rate | ZDnet Speedtest vs Ookla Speedtest | ZDnet speedtest vs PingER NDT |
|---|---|---|
| | |
For further validation see Throughput versus Loss where a correlation of R 2 ~ 0.85 is obtained for derived ping throughputs versus actual throughputs measured by Andy Germain in 1999 using ttcp between GSFC and LANL .