We looked at plots of RTT vs Distance for pairs of Landmarks within 25ms and 1000km radii for Europe and N. America. Typically a formula of the form distance = alpha * RTT is used to derive the distance from the measured RTT. Typical values of alpha are 40 km/ms. However the value of alpha can vary dramatically based on the route the cable takes versus teh great circle distance. Fior example from the US to Japan the route is pretty direct leading to high values of alpha. However from Europe to Japan the route today goes West around the bay of Biscay, through the Mediterranean and the Red Sea, South of India, then passes via Singapore and North up the East coast of Asia to Japan. This result in smaller values of alpha. There are plans afoot to provide more direct routes via the Arctic Ocean.
When we measured the RTTs between landmarks of known location and derived the values of alpha, Europe seemed better behaved. We looked at the network topology for the major Academic and Research (A&R) networks in N. America, i.e. Internet2, ESnet and Canarie. They are shown below.
...
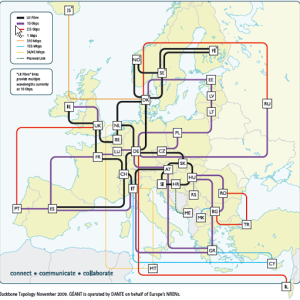
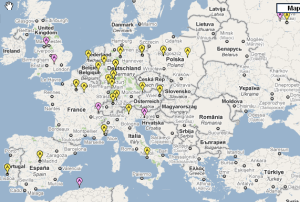
We also looked at the European Academic and Research network GEANT, together with the Landmark locations in Europe. See below:
GEANT | European landmarks |
|---|---|
| |
The worldwide cable routes can be see:
- For Level3
- For African submarine cables
- For African land cables
- Telegeography world wide submarine cable map
Our initial results depict better (less variability in alpha, density of landmarks (i.e. number of landmarks with the designated radius of each other), and correlation between RTT and distance) intra regional connectivity in Europe than in North America. Both North America and Europe have many n*Gigabits links connecting one state to another in N.America or one country to another in Europe. We wish to see the state of connectivity of landmarks within a few hundred miles radius around each target landmark since these are the landmarks that are most likely to be used in the eventual algorithm.
...
then for all landmarks within say 500km of each other we can measure the min_RTT each landmark to each other landmark (target) and find the average and standard deviations for each landmark. We did this for Europe and N. America and plots of alpha(opt) vs landmark for landmarks within 500km of each other are shown below in plots from the spreadsheet eu-na-opt-alphaaplha.xlsx spreadsheet. For For Europe it is seen that landmarks on the periphery such as the UK and Poland have larger values of Alpha. Possibly this is since there is less meandering on the longer distance links.
...