...
Sat Oct 12 10:48:28 2019 create-motion-chart-pages.pl: finished, took 239 secs.
I followed the instructions for Enabling Flash in Chrome at https://support.digication.com/hc/en-us/articles/115003963468-Enabling-Flash-for-Google-Chrome-Windows-Macintosh-2.0.0 is installed in this browser
- Made sure Flash was enabled.
- According to https://www.whatismybrowser.com/detect/what-version-of-flash-is-installed I have version 32.0.0.
- Reloaded the web page: https://www-iepm.slac.stanford.edu/pinger/pinger-metrics-motion-chart.html.
Chrome No change.
- Viewed source and made sure change had taken effect
- Looked in Developer tools, noted the following which may be of interest
- pinger-metrics-motion-chart.html:51508 A parser-blocking, cross site (i.e. different eTLD+1) script, https://ssl.google-analytics.com/ga.js, is invoked via document.write. The network request for this script MAY be blocked by the browser in this or a future page load due to poor network connectivity. If blocked in this page load, it will be confirmed in a subsequent console message. See https://www.chromestatus.com/feature/5718547946799104 for more details.
- (anonymous) @ pinger-metrics-motion-chart.html:51508
- pinger-metrics-motion-chart.html:1 Cross-origin plugin content from must have a visible size larger than 400 x 300 pixels, or it will be blocked. Invisible content is always blocked.
Firefox No change
- Followed instructions at https://support.mozilla.org/en-US/kb/install-flash-plugin-view-videos-animations-games
- Agreed to license, manually downloaded latest Flash and completed installation
- Updated Firefox 69.0.1
- Restarted Firefox, enable Adobe Flash.
- Same result as Chrome
Umar pointed the problem was related to having no data for Normalized throughput. If one chooses another metric for the y axis default then the content is displayed.
Normalized throughput is automatically updated by prm.pl via trscrontab on pinger@pinger.slac.stanford.edu
Code Block pinger;1300 30 07 04 1 * /afs/slac.stanford.edu/package/pinger/prm/prm.pl -lp true -c /afs/slac.stanford.edu/package/pinger/prm/prm-allyearly-continent.conf #takes 11 mins on PingER 11/24/2012
- Ran it manually to be sure and looked at the date updated: -rw-rw-rw- 1 pinger sf 1143 Oct 14 10:18 nthroughput-EDU.SLAC.STANFORD.PINGER-continent-allyearly.csv
- Reran create-motion-chart-pages.pl
- No change.
- Looked at the file https://www-iepm.slac.stanford.edu/pinger/prmout/nthroughput-EDU.SLAC.STANFORD.PINGER-continent-allmonthly.csv (created by prm.pl using the configuration file /afs/slac.stanford.edu/package/pinger/prm/prm-allyearly-continent.conf) and found it contained all periods ('.'). The configuration file looks OK. Reordered prm-allyearly-continent.conf and re-ran prm.pl. On the other hand the file https://www-iepm.slac.stanford.edu/pinger/prmout/throughput-EDU.SLAC.STANFORD.PINGER-country-allyearly.csv appears OK.
- Executing prm.pl with the above .conf file it appears data is available in for example https://www.slac.stanford.edu/cgi-bin/pingtable.pl?file=throughput&by=by-node&size=100&tick=allyearly&from=EDU.SLAC.STANFORD.PINGER&to=Africa&ex=none&only=all&ipv=all&dataset=hep&percentage=any, as well as for the equivalent files=minimum_rtt and file=packet_loss.
- Fixed missing single quotes (') in mon-lib.pl sub wget. Now https://www-iepm.slac.stanford.edu/pinger/prmout/nthroughput-EDU.SLAC.STANFORD.PINGER-continent-allyearly.csv has data.
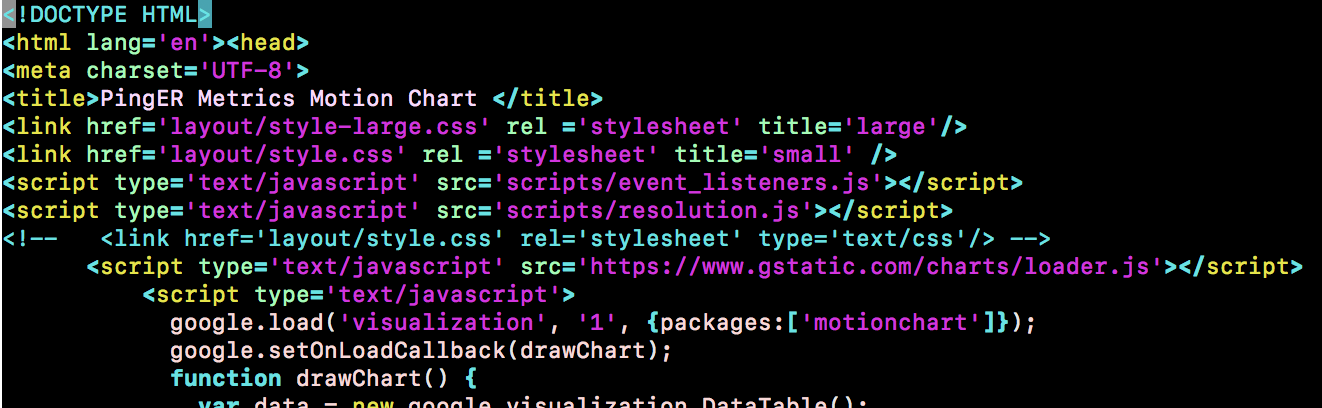
- Look at source of pinger-metrics-motion-char.html, Normalized throughput is metric_index 4 in data.setValue(datapoint_index,metric_index,region), however it does not show up.
- Look at: /afs/slac/package/pinger/motion-chart/create-motion-chart-page.pl -r Europe -f EDU.SLAC.STANFORD.PINGER -t allyearly. The normalized throughput file is /afs/slac/g/www/www-iepm/pinger/prmout/nthroughput-EDU.SLAC.STANFORD.PINGER-country-allyearly.csv. However, this file (AKA https://www-iepm.slac.stanford.edu/pinger/prmout/nthroughput-EDU.SLAC.STANFORD.PINGER-country-allyearly.csv) has no data, e.g.
allyearly,?,1998,1999,2000,2001,2002,2003,2004,2005,2006,2007,2008,2009,2010,2011,2012,2013,2014,2015,2016,2017,2018,2019
EDU.SLAC.STANFORD.PINGER-to-Afghanistan,.,.,.,.,.,.,.,.,.,.,.,.,.,.,.,.,.,.,.,.,.,.,.,
EDU.SLAC.STANFORD.PINGER-to-Albania,.,.,.,.,.,.,.,.,.,.,.,.,.,.,.,.,.,.,.,.,.,.,.,
Re-ran /afs/slac.stanford.edu/package/pinger/prm/prm.pl -lp true -c /afs/slac.stanford.edu/package/pinger/prm/prm-allyearly-slac.conf to yield https://www-iepm.slac.stanford.edu/pinger/prmout/nthroughput-EDU.SLAC.STANFORD.PINGER-country-allyearly.csv AKA /afs/slac/g/www/www-iepm/pinger/prmout/nthroughput-EDU.SLAC.STANFORD.PINGER-country-allyearly.csv which has data in it.