...
The ATICS survey of 84 leading tertiary institutions in Africa found 850,000 students and staff with access to a total of only 100Mbps international bandwidth. By contrast, Australia's tertiary community of 250,000 share 6Gbps of international bandwidth (although even this is still insufficient to meet their needs).
Costs
Wiki Markup
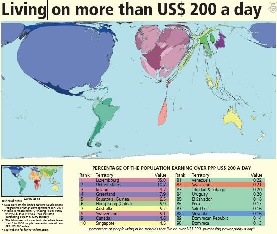
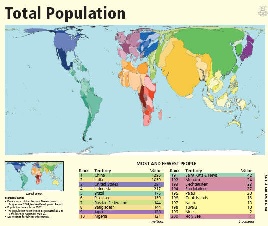
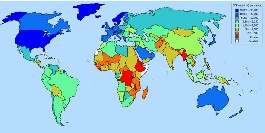
Figure 14a: 2002 | Figure 14b: | Figure 14c: GDP/capita for 2006 |
|---|---|---|
| |
|
...
Despite the general trend toward population ageing, countries that still have relatively high fertility will have a younger population than the rest by 2050. Mostly least developed countries are in this group. In 2050, the youngest populations will be found in 11 least developed countries whose median ages are projected to be at or below 23 years. These countries include Angola, Burundi, Chad, the Democratic Republic of Congo, Equatorial Guinea, Guinea-Bissau, Liberia, Niger and Uganda. Today, the median age in Mali, Niger and Uganda is16 years or less, making their populations the youngest in the planet.
Wiki Markup
http://www.un.org/esa/population/publications/WPP2004/2004Highlights_finalrevised.pdf]\]
This is illustrated in the map in figure 15b where the data is from the UN "World Population Prospects, The 2004 Revision".
...
Worldwide Comparison
| Include Page | ||||
|---|---|---|---|---|
|
MOS for various Regions
| Include Page | ||||
|---|---|---|---|---|
|
Information on Calculation MOS can be found at http://www.slac.stanford.edu/comp/net/wan-mon/tutorial.html#mos
TCP throughput from CERN & SLAC to World Regions
| Include Page | ||||
|---|---|---|---|---|
|
PingER Metrics for Africa
...
Some Examples of the Impact
| Include Page | ||||
|---|---|---|---|---|
|
In 2006, the ATICS survey of 84 leading tertiary institutions in Africa found 850,000 students and staff with access to a total of only 100Mbps international bandwidth. By contrast, Australia's tertiary community of 250,000 share 6Gbps of international bandwidth (although even this is still insufficient to meet their needs).
...
Possible Remedies
| Include Page | ||||
|---|---|---|---|---|
|
...
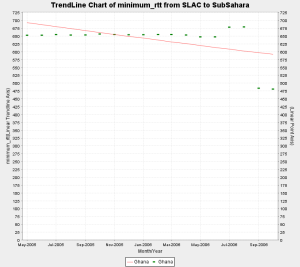
- Very recent data for Ghana i.e. (Sep and Oct 2006) inidcates a shift from satellite to fiber. In particular if we examine the individual hosts we monitor in Ghana, one of the hosts shows a step change from 680+ ms to 260+ms, while the other still continues to show satellite indicating that part of the coutry may be shifting to fibre. Further more when we looked up the asn on both the hosts, the asn for host performing poorly was described as INTELSAT while the host which is now performing better had an ASN description of "UNSPECIFIED, NETWORK COMPUTER SYSTEMS, ACCRA GHANA".
- There was a step change in the min RTT of Eritrea from 625 ms to 700 ms approx. in Sep, 2004.
...