...
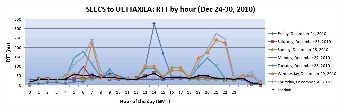
24th to 30th December was when university was back to normal routine after strike holidays. In that case, the analysis is at the correct data. The important observations at this data were that high RTTs were observed from 12am to 4am and at 10am to 1pm PST (PST= GMT + 5). This is the second last week before final exams and students are busy in final projects and submissions because of which network utilization is expected to be high. During daytime until 3:30pm PST when the classes are on, internet access is blocked to the hostels. After 3:30pm PST it is enabled in the hostels as well which results in an increased number of users. An increase in RTT is therefore observed at times around 5.30 pm PST (12.30 pm GMT) as shown and remains so till early morning of the following day. This can be seen in the hourly graph shown below.
|
From 7th Jan to 17th Jan there were pre-exam holidays. From 7th to 13th Jan average RTT was higher than previous days of 4th Jan to 6th Jan. This is because of students using internet for multiple purposes in their holidays. This might include social networking when youtube is blocked. From 14th Jan onwards high average RTTs are observed after midnight till early morning. This is possibly because students have now started preparing for exams and they study at night.
...