...
The Seacom undersea fibre optic cable plugging East Africa into high speed Internet went live Thursday July 23, 2009. See the BBC and CNN reports. Such a cable should dramatically reduce the cost of bandwidth measured in $/Mbps, and reduce the Round Trip Times (RTT) from >~ 480 ms for a geostationary satellite, down to 200-350ms by using shorter distance terrestrial routes.
Current State
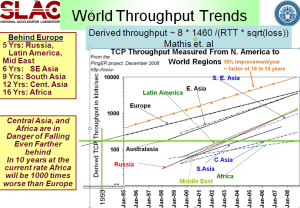
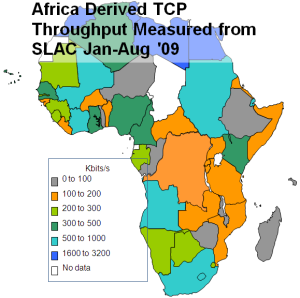
The throughputs measured to Africa from N. America for the last decade are shown below in the left hand figure. It is seen that not only do African sites lag the rest of the world in throughput being roughly in the state that European sites were over a decade and a half ago, but also they are falling further behind. Further, bear in mind that for Africa, Mediterranean countries and South Africa have the better perfomance and E. Africa is the worst off (see the the middle left map). Thus the arrival of a terrestrial submarine fibre cable link to the rest of the world for E. Africa is a very significant development.
The minimum RTTs measured from SLAC to African countries in August 2009 is seen below.
In this case study we look at the current state of Internet access for Africa as measured by the PingER project and also at the effect of the new submarine cable connections on the Round Trip Times (RTT) to countries of Africa as seen from SLAC near San Francisco. Below is seen a map of over 165 sites that PingERmonitors in 50 countries in Africa. The red dots indicate PinGER monitoring sites, the blue are beacon sites that are monitored by all monitoring sites, and the green are other sites monitored by at least one monitoring site. 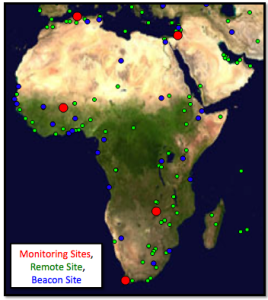
Current State
The throughputs measured to Africa from N. America for the last decade are shown below in the left hand figure. It is seen that not only do African sites lag the rest of the world in throughput ,being roughly in the state that European sites were over a decade and a half ago, but also they are falling further behind withy time. Further, bear in mind that for Africa, Mediterranean countries and South Africa have the better perfomance and E. Africa is the worst off (see the the middle left map). Thus the arrival of a terrestrial submarine fibre cable link to the rest of the world for E. Africa is a very significant development.
The minimum RTTs measured from SLAC to African countries in August 2009 is seenin the m.ap on the rightOn the right is seen a map of over 165 sites that PingER monitors in 50 countries in Africa. The red dots indicate PinGER monitoring sites, the blue are beacon sites that are monmitored by all monitoring sites, and the green are other sites monitored by at least one monitoring site.
<ac:structured-macro ac:name="unmigrated-wiki-markup" ac:schema-version="1" ac:macro-id="acda23e2801dd394-3b9dfd41-41154c70-bbc8b5e5-2ffa14f00cee68479e26b363"><ac:plain-text-body><![CDATA[ | Throughput to Africa from SLAC to Regions of the World | Derived Throughput from SLAC to Africa Jan-Aug '09 [[xls | ^africa-thru-aug09.xls]] | MinRTT from SLAC - Aug. 2009 [[xls | ^map-africa-minrtt-aug2009.xls]] | PingER Coverage in Africa | ]]]></ac:plain-text-body></ac:structured-macro> |
|---|---|---|---|---|---|---|---|
| |
|
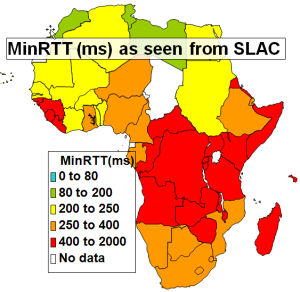
The striking number of countries in Eastern and Central Africa with minimum RTTs of >400ms is indicative that they were using geo-stationary GEO-Stationary (GEOS)satellite links. The new cable should also result in less loss and jitter due to the reduction in congestion caused by the increase in capacity.
...
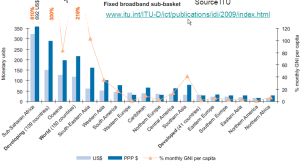
East Africa contains 300M people, yet less than 3% are Internet users (see Internet usage for Africafor Africa). Bandwidth in Africa is very expensive. See for example the left hand figure below when it is seen that bandwidth costs for broadband in Sub-Saharan Africa are 30-40 times that in the US. Taken together with the earnings differences, what takes say 15% of a US Gross National Income (GNI) per capita will take over 800% of a Sub-Saharan GNI per capita.
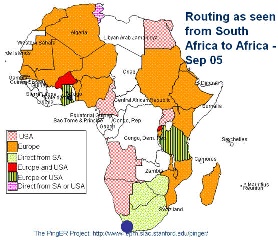
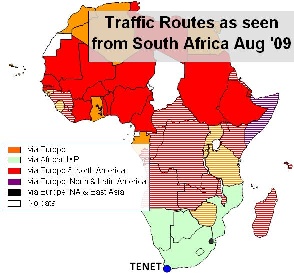
). In the past the area has had poor Internet connectivity with mainly heavy use of expensive (in terms of $/Mbps) geostationary satellite connections to the outside world. (see above) In addition most of the traffic between countries made use of expensive international links via Europe and the U.S. rather than more direct connections. There are active movements to create National Research and Education Networks (NRENs) in the area, see for example "Sub-Saharan Africa: An update" by Boubaker Barry. This, together with direct connections between countries will enable more direct peering. These NRENs in turn are peering with the GEANT network in Europe through the Ubuntunet Alliance. The map below shows the state of African NRENs in 2008 and to the right of it the Founding Ubuntunet Alliance members and those who have joined since the founding.
Costs of Broadband Internet Access in Countries of the world. | NRENs in Africa | Ubuntunet Alliance |
|---|---|---|
| | |

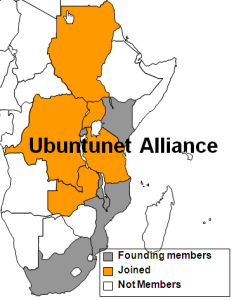
It can be seen that NRENs are being created.
...
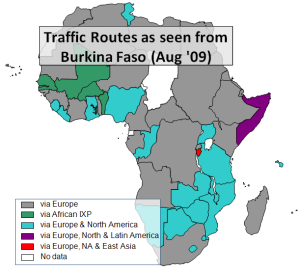
<ac:structured-macro ac:name="unmigrated-wiki-markup" ac:schema-version="1" ac:macro-id="70c2310cc227fdc0-4769b0fb-41d2482b-abf69739-a87701654eb6958c84cb411b"><ac:plain-text-body><![CDATA[ | Routing from South Africa to African Countries (Sep '05) | Routing from South Africa to African Countries (Aug '09) [[xls | ^routing-africa-aug2009.xls]] | Routing from Burkina Faso to African Countries (Aug '09) [[xls | ^routing-africa-aug2009.xls]] | ]]></ac:plain-text-body></ac:structured-macro> |
|---|---|---|---|---|---|---|
| | |
...