...
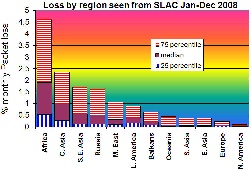
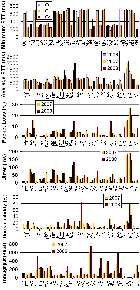
Loss variability
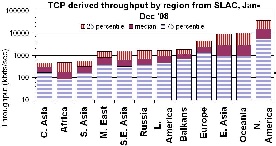
| Throughput variability
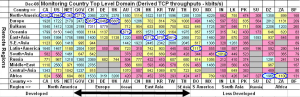
| Region to Country Throughputs
| Region to Country Throughputs
annotated
|
|---|
|  |  | 
|
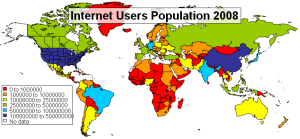
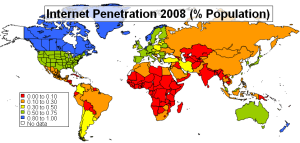
Given the saturation of many developed markets there is considerable attraction to exploring emerging markets, especially those with young populations.
Internet Users Population 2008
| Internet Penetration 2008 (% Pop)
| Emerging Markets (Vital Wave)
|
|---|
 |  | 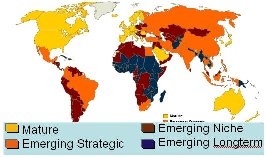 Image Added Image Added |
Trends
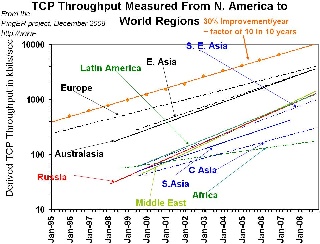
Throughput from SLAC
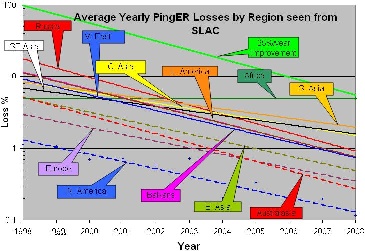
| Loss from SLAC
| Minimum RTT from SLAC
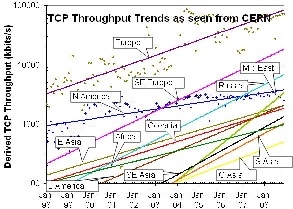
| Throughput from CERN
|
|---|
 |  |  |  |
...
MinRTT, AvgRTT, Packet Loss,
Jitter and Ping Unreachability
2007 and 2008
(raw data)
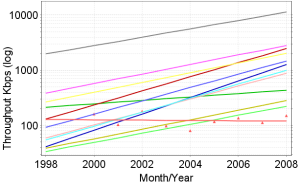
| Derived Throughput (Kbps)
to the world as seen from
SLAC since 1998
(graphs)
|
|---|
 | 
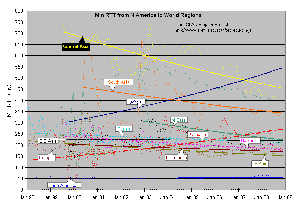
<ac:structured-macro ac:name="unmigrated-wiki-markup" ac:schema-version="1" ac:macro-id="915e16f788876820-774ec980-473a40b9-8184a980-97ebe793a08a392ec0735859"><ac:plain-text-body><![CDATA[[Red: Africa, Light-blue: Balkans, Light-green: Central Asia,
]]></ac:plain-text-body></ac:structured-macro>
Yellow: East Asia, Pink: Europe, Light-blue: Latin America,
Orange: Middle East, Grey: North America, Maroon: Oceania,
Royal-blue: Russia, Dark-green: S.E. Asia, Mustard: S. Asia,
Red-triangles: Africa - measurement points]
|
...