Page History
...
Spectrum with statistical data
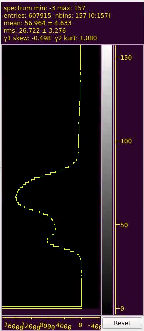
Click and drag or scroll mouse on spectrum to select its part projected on color map on image. The same works for vertical axis. Horizontal scale does the same things for histogram scale.
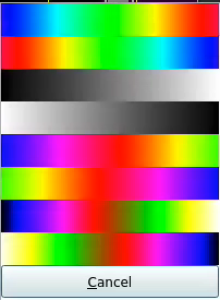
Color bar selection
Click on color bar and select color map from pop-up window. The color bar and Image will be updated after selection is done.
Logger

Control fields and buttons
...
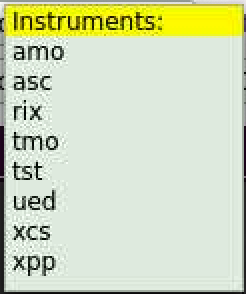
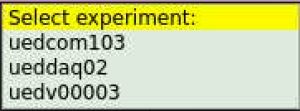
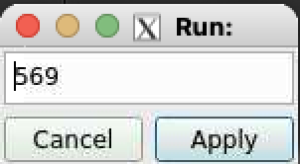
Select DB parameters
After click on the next to DataSource button a bunch of sequentially popsequentially pop-up windows for instrument, experiment. and run number simplify to set DB parameters.
Select detector
After click on the next to Detector button pop-up menu windows allows to select detector from DB
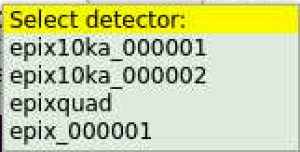
If geometry is available for specified DataSource and Detectopr arguments the field next to geo DB will be filled out automatically.
ROI control buttons
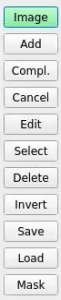
Translate and zoom image
Click on Image mode button, then click and drag or scroll mouse for translation or zumming zooming image, respectively. At release mouse button spectrum will be updated for visible portion of the image.
Add ROI
Click on Add button and select ROI type from pop-up menu:
...
Overview
Content Tools