...
- A timeline for COVID-19 can be found here. Also looking at a map of how the COVID-19 traveled the world or the HealthMap one can see how and when various regions were impacted. Also see the Unacast interactive Social Distancing Scoreboard, updated daily, to empower organizations to measure and understand the efficacy of social distancing initiatives at the local level.
- Unacast is only for the US. It is broken down into States and counties. It uses cell phone location data to track locations. From this it derives for example distance traveled. An example of the information aggregated for the US is below (in the chart the bars are the new cases, the red dots are events, the state map colors are green for low mobility and dark orange for high mobility). Similar information is available state by state.

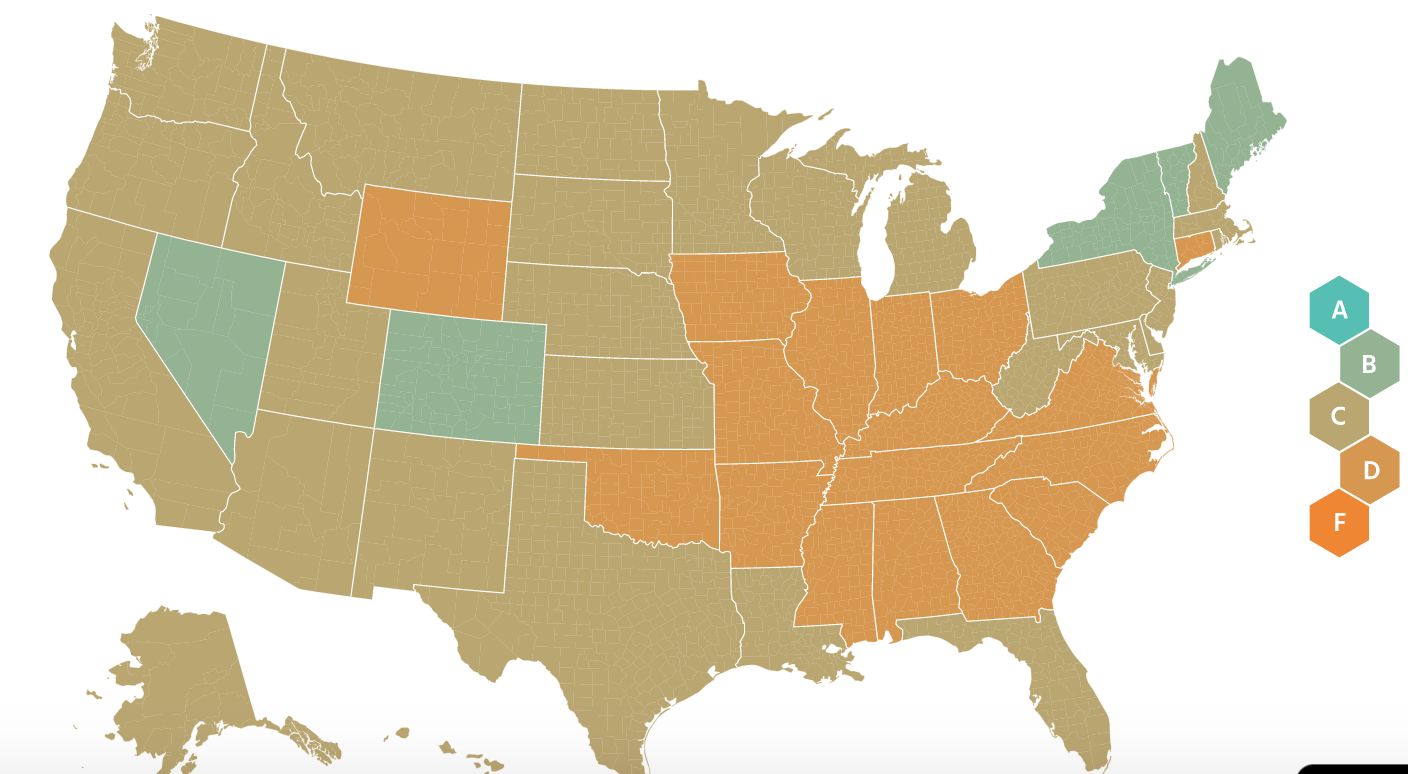
- Unacast is only for the US. It is broken down into States and counties. It uses cell phone location data to track locations. From this it derives for example distance traveled. An example of the information aggregated for the US is below (in the chart the bars are the new cases, the red dots are events, the state map colors are green for low mobility and dark orange for high mobility). Similar information is available state by state.
- For detailed statistics see:
- For the raw data:
- You can get up-to-date raw data on the coronavirus from Johns Hopkins from their GitHub site: https://github.com/CSSEGISandData/COVID-19. They have daily summaries and time-series data, both available as CSV files. You just have to browse around a bit to find what you want.
- To get down to the level of US states and counties see https://github.com/nytimes/covid-19-data
- For scientific modeling of the COVAD-19's impacts see:
- The Imperial College London reports on the Impact of non-pharmaceutical interventions (NPIs) to reduce COVID19 mortality and healthcare demand and Estimating the number of infections and the impact of non-pharmaceutical interventions on COVID-19 in 11 European countries.
- Projections for US hospital resources and deaths.
- For Interventions see
- For Intevention stringency vs cases see https://www.bsg.ox.ac.uk/sites/default/files/2020-04/BSG-WP-2020-031-v4.0_0.pdf
Notes:
- For Europe, US and Canada the Christmas/New Year season (end November thru 2nd week in January) may also be expected to change behaviors, so comparing with data before the first cases (Nov-Jan) may be tricky.
- Also the measurements are from SLAC which shutdown on March 17th, 2020, so the traffic on its links may have dramatically decreased after that.
- The links from SLAC use the well-provisioned ESnet network and beyond that academic networks such as Internet2 in the US, GEANT in Europe, APAN in Asia so the measurements from SLAC may not be fully representative.
- Many of the targets are academic establishments that may have been closed, thus the target itself may be lightly loaded and so respond more quickly than in the past.
...