...
A timeline for COVID-19 can be found here. Also looking at a map of how the COVID-19 travelled the world or the HealthMap one can see how and when various regions were impacted. Also see Coronavirus Disease (COVID-19) – Statistics and Research and COVID-19 Coronavirus - Update for detailed statistics. For the raw data you can get up-to-date raw data on the coronavirus from Johns Hopkins from their GitHub site: https://github.com/CSSEGISandData/COVID-19. They have daily summaries and time series data, both available as CSV files. You just have to browse around a bit to find what you want. For scientific modeling of the COVAD-19 see Imperial College London reports on the Impact of non-pharmaceutical interventions (NPIs) to reduce COVID19 mortality and healthcare demand and Estimating the number of infections and the impact of non-pharmaceutical interventions on COVID-19 in 11 European countries
Note that for Europe, US and Canada the Christmas/New Year season (end November thru 2nd week in January) may also be expected to change behaviors.
Milestones
| 1st identified case | |||
| 1st community case | |||
| Interventions | |||
Also see COVID 19 Internet Usage timeline for how companies have reduced their Internet traffic.
Monitoring
The PingER monitor at SLAC, Stanford University in California currently monitors about 100 hosts in China. Using the pingtable.pl web page we selected daily aggregated data from SLAC to China for the last 365 days and looked at various metrics derived from the RTTs. Since many of the targets are Universities that may have taken lockdown measures and sent many students and staff home, we decided to look at the overall impact on SLAC to China pings. To do this we scroll down the pingtable.pl page to summary tables as shown below. 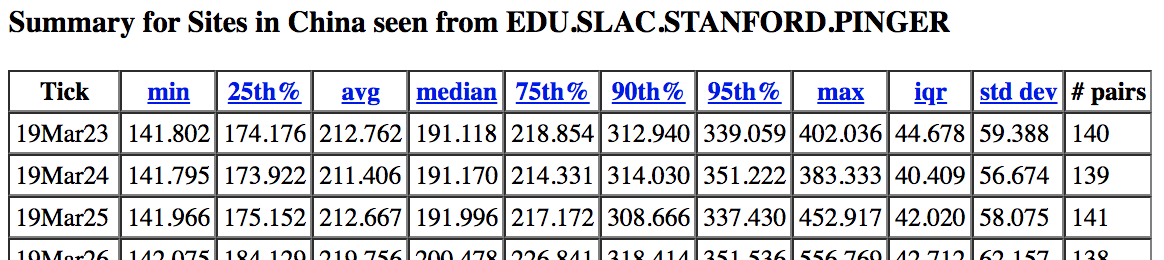
...
- Impact of non-pharmaceutical interventions (NPIs) to reduce COVID19 mortality and healthcare demand, 16 March 2020
- Estimating the number of infections and the impact of non-pharmaceutical interventions on COVID-19 in 11 European countries, 30 Matrch March 2020
Probably the best source of PingER data is https://www-iepm.slac.stanford.edu/pinger/prmout/ which is aggregated data for various metrics by region and time window (or tick).
...