...
For example, one might expect that as schools shut, people self isolate, are sent home from. work, work from home, lockdowns are imposed etc., physical person-to-person communications would migrate to the Internet and will increase the use of the Internet e.g. by virtual learning, streaming, etc. to gather information and entertain. The thought is that this will lead to different Internet patterns and possibly lead to Internet congestion. A study of the impact of COVID-19 on Internet speeds by Ookla ("TRACKING COVID-19’S IMPACT ON GLOBAL INTERNET PERFORMANCE") is directly relevant, however, it is hard to identify any dramatic impact on the latencies in the report. There is also COVID-19 impacts on Internet traffic: Seattle, Northern Italy and South Korea which looks at the impact on Internet traffic volumes. Also companies such as Netflix, Amazon, Apple, Disney, Google have reudced reduced the quality of their videos to help reduce traffic and congestion of the Internet (see https://www.traffic-masters.net/covid19-web-traffic-statistics/).
PingER uses the ping facility to measure the Round Trip Time (RTT) between about 20 monitoring sites and target hosts in over 160 countries (over 10,00 000 pairs of monitor-remote(target site)_sites. Every 30 minutes the monitor sends up to 30 pings at one second intervals to each target until there are 10 responses, and records the data which are daily gathered, archived, analyzed and presented at the archiving site.
...
The PingER monitor at SLAC, Stanford University in California currently monitors about 100 hosts in China. Using the pingtable.pl web page we selected daily aggregated data from SLAC to China for the last 365 days and looked at various metrics derived from the RTTs. Since many of the targets are Universities that may have taken lockdown measures and sent many students and staff home, we decided to look at the overall impact on SLAC to China pings. To do this we scroll down the pingtable.pl page to a summary tablesummary tables as shown below. 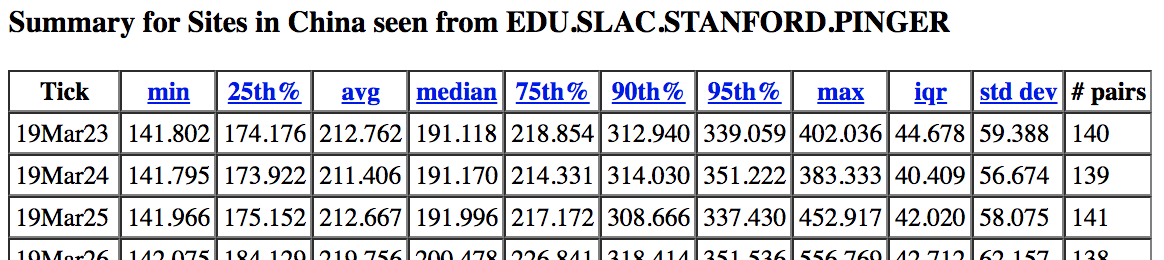
We can cut and paste this table into Excel to enable further analysis and visualization. Also the summary data is analyzed on a regular basis and the results made available as CSV files at https://www-iepm.slac.stanford.edu/pinger/prmout/. The file names (e.g.average_rtt-EDU.SLAC.STANFORD.PINGER-continent-allmonthly.csv) provide the metric (average_rtt in example), the Monitoring Agent (EDU-SLAC.STANFORD.PINGER in example), the region (continent or country) and the time window of each data point (or Tick, e.g. monthly (=last 12 months), allmonthly, or allyearly).
Looking at the plot of daily average RTTs there is a peak (going from 145ms to 160ms) in minimum (average RTT) from Jan 10 to Jan 24th 2020, plus another spike on Feb 19.
...