Introduction
This addresses the question of whether the PingER data can identify the impact of COVID-19 on the Internet. According to https://thrivenextgen.com/covid-19-impact-on-internet-performance/ Most Internet Service Providers (ISPs) oversubscribe their bandwidth and networks as typical inbound and outbound traffic are bursty and often don’t sustain high levels on a continuous basis. Fortunately, most of the larger National Providers have had sufficient time to prepare for the impact of COVID-19 and plan for the possibility of business workloads shifting to the home. Regardless of this capacity planning, Internet traffic patterns are about to change drastically based on schools across the country opting for virtual learning and business work from home migrations.
For example, one might expect that as schools shut, people self isolate, are sent home from. work, work from home etc., physical person-to-person communications would migrate to the Internet and will increase the use of the Internet e.g. by virtual learning, streaming, etc. to gather information and entertain. The thought is that this will lead to different Internet patterns and possibly lead to Internet congestion. A study of the impact of COVID-19 on Internet speeds by Ookla ("TRACKING COVID-19’S IMPACT ON GLOBAL INTERNET PERFORMANCE") is directly relevant, however, it is hard to identify any dramatic impact in the report. There is also COVID-19 impacts on Internet traffic: Seattle, Northern Italy and South Korea which looks at the impact on Internet traffic volumes
PingER uses the ping facility to measure the Round Trip Time (RTT) between about 20 monitoring sites and target hosts in over 160 countries (over 10,00 pairs of monitor-remote target site). Every 30 minutes the monitor sends up to 30 pings at one second intervals to each target until there are 10 responses, and records the data which are daily gathered, archived, analyzed and presented at the archiving site.
A timeline for COVID-19 can be found here. Also looking at a map of how the COVID-19 travelled the world or the HealthMap one can see how and when various regions were impacted. Note that for Europe, US and Canada the Christmas/New Year season (end November thru 2nd week in January) may be expected to change behaviors.
China and North America
The PingER monitor at SLAC, Stanford University in California currently monitors about 100 hosts in China. Using the pingtable.pl web page we selected daily aggregated data from SLAC to China for the last 365 days and looked at various metrics derived from the RTTs. Since many of the targets are Universities that may have taken lockdown measures and sent many students and staff home, we decided to look at the overall impact on SLAC to China pings. To do this we scroll down the pingtable.pl page to a summary table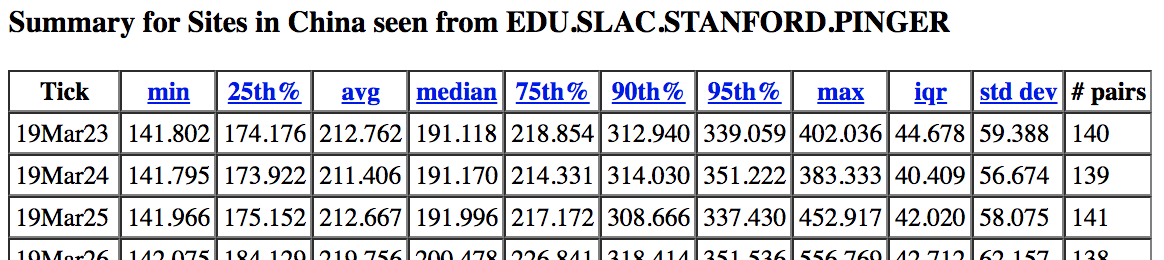
We cut and paste this table into Excel to enable further analysis and visualization.
Looking at the plot of daily average RTTs there is a peak (going from 145ms to 160ms) in minimum (average RTT) from Jan 10 to Jan 24th 2020, plus another spike on Feb 19.

A similar result is seen for the daily minimum RTTs.

Currently I do not know why we see these bumps or what they are telling us.
Looking at the Inter Packet Delay Variation (IPDV, ) a measure of the variability between adjacent ping packet RTTs there is some evidence that the variability reduced between 18th Jan and March 10th 2020. The first person in China to die of the COVID-19 virus was reported on January 10th, and by January 31st there were 9,720 cases in China. Looking in more detail at the Healthmap one sees
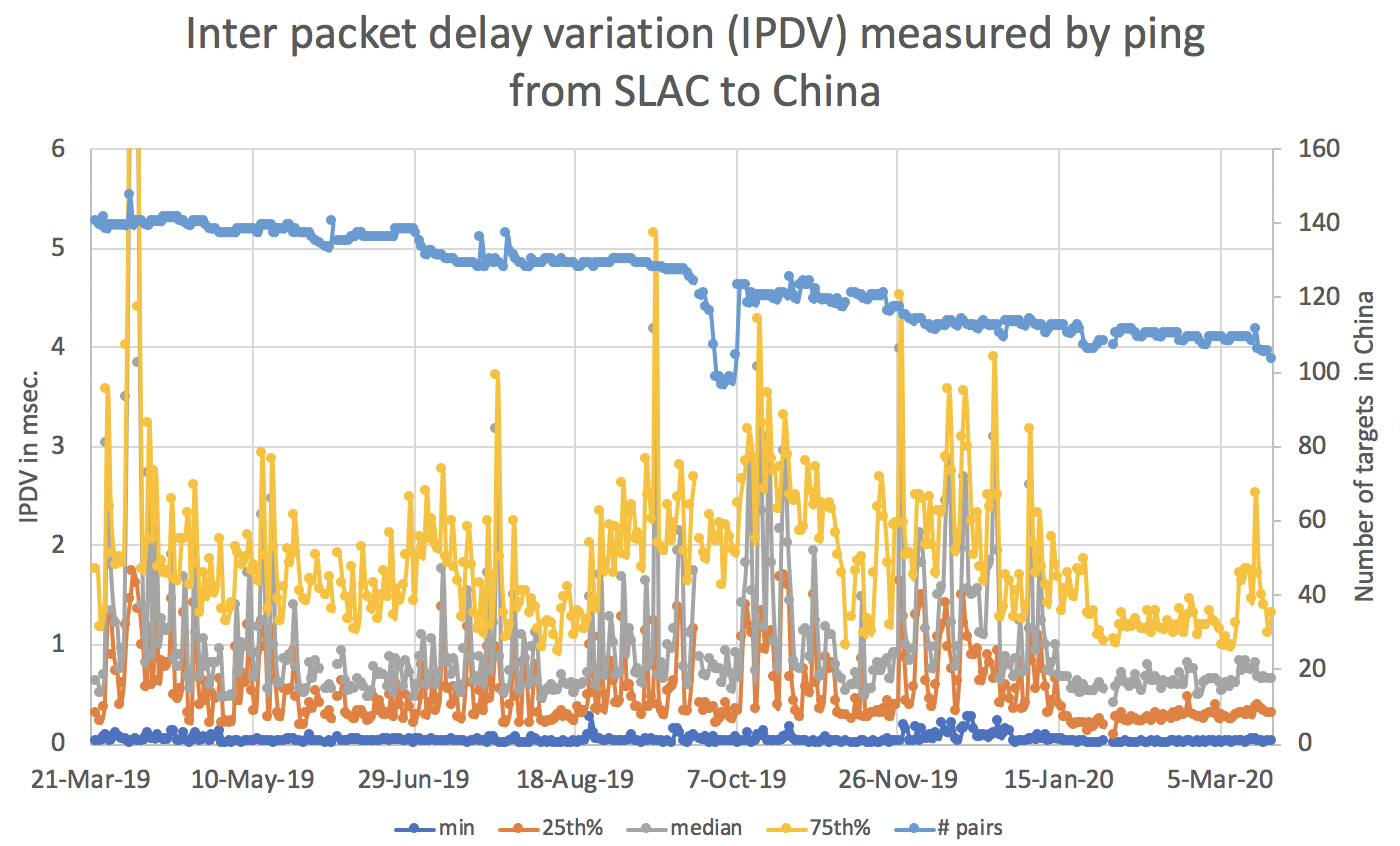
Looking in more detail at the Healthmap one sees the dramatic spread of the virus in China between January 13 and January 20, 2020. Thus the drop in IPDV RTTs may indeed be linked to the impact of the growth of COVID-19 infections in China.
| January 13, 2020 | January 20, 2020 |
|---|---|
 | 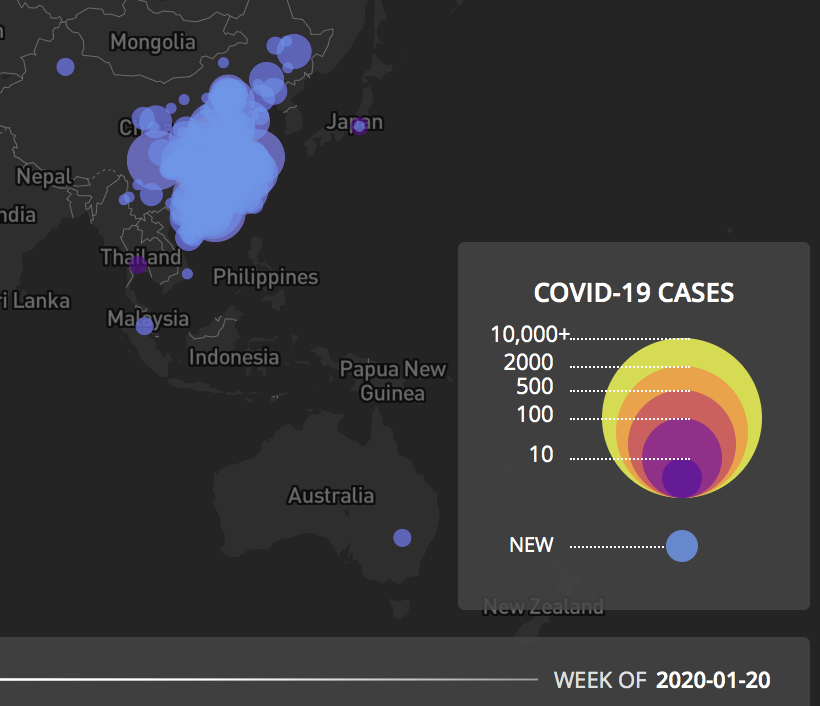 |
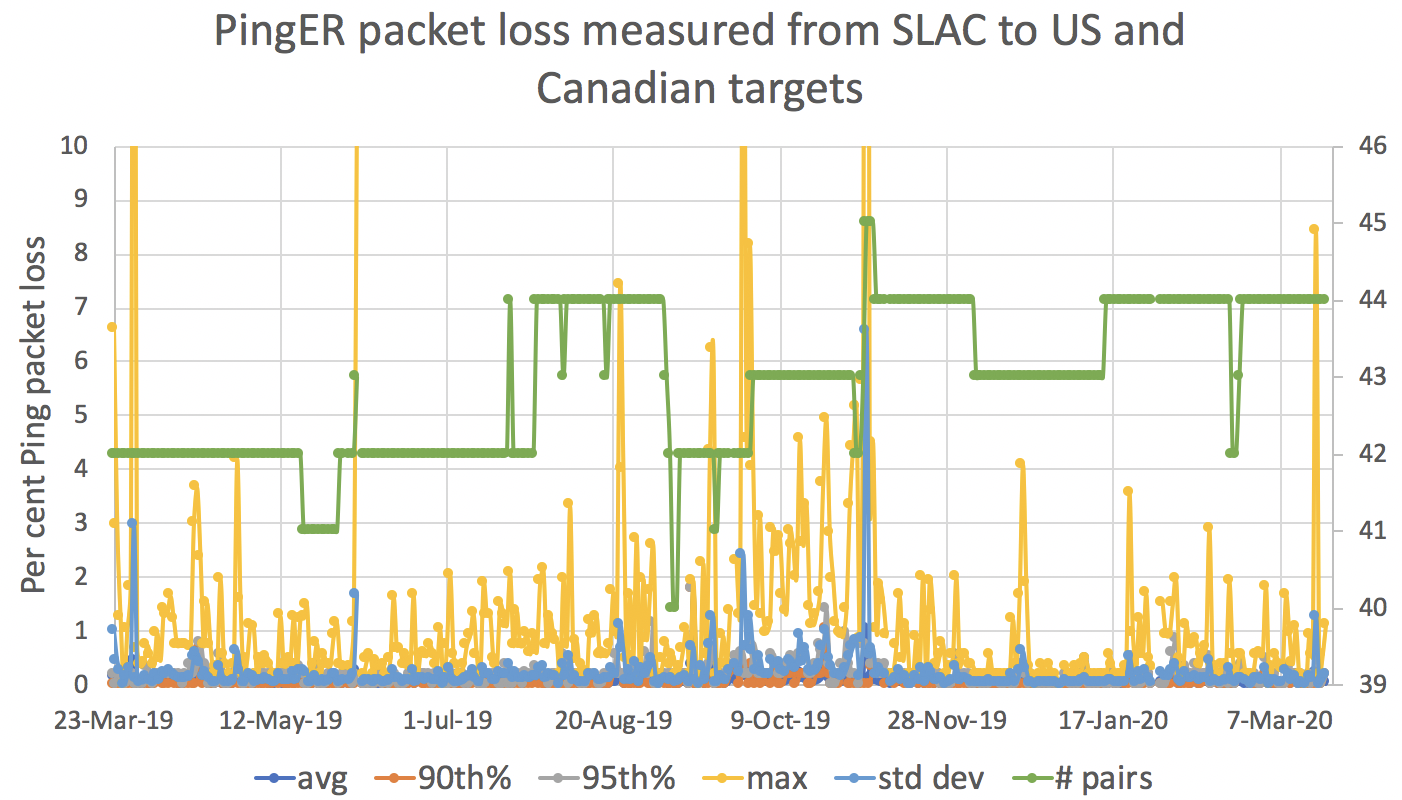
I can see nothing similar when looking at the US and Canada (N. America) IPDV data, maybe the effect is later in the evolution of the virus' impact.

Aggregating the IPDV data monthly for China we see the following where we show the median together with the 25% and 75% going back to September 2017:

Looking at the percent packet loss for China there may be some evidence for a change in the 75%. Thus the impact is seen for a few sites. However, the climb started in August-September 2019 so it is doubtful it is related to COVID-19. This conclusion is confirmed by looking at the monthly aggregates.

For the US and Canada the losses are lower and usually 0% (typically >=90% of the targets show no losses), so instead we show the average maximum losses
PingER monitors two hosts in Hubei: www.hbmy.edu.cn at Hubei University for Nationalities and Hubei University of Automotive Technology and www.huat.edu.cn at the Hubei University of Automotive Technology. The hourly measurements for www.hbmy.edu.cn are shown below (one can use the form https://www.slac.stanford.edu/cgi-bin/ping_data_plot.pl to create such a plot).
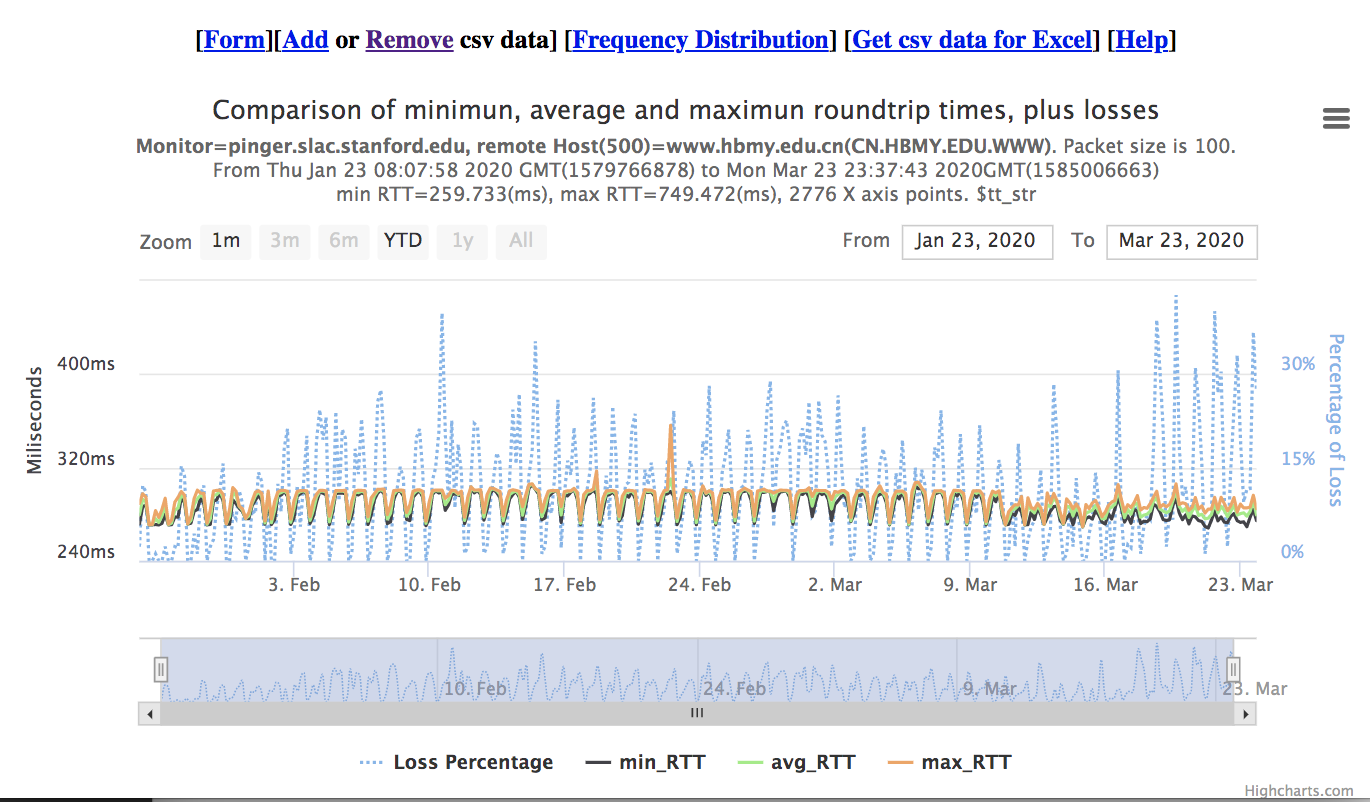
In general there are marked diurnal changes. There is a slight increase in RTTs following the Chinese New Year January 25th 2020. Then there is a small step reduction in RTTs March 10, 2020, followed by an increase in the packet losses starting March 18th 2020.
| PingER average hourly RTT from SLAC to Hubei University for Nationalities | PingER percent hourly packet loss from SLAC to Hubei University for Nationalities |
 |  |
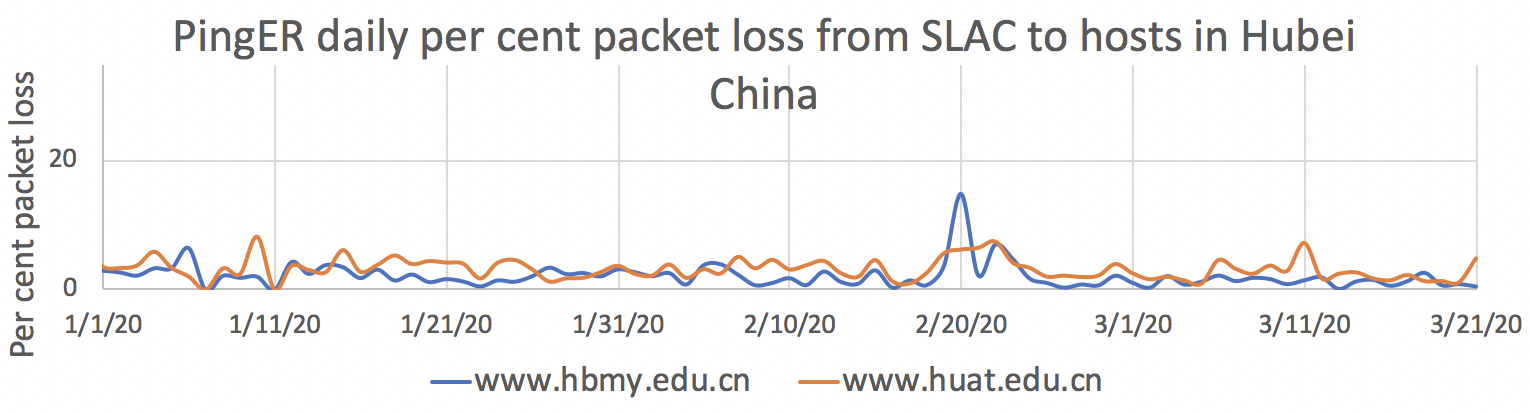
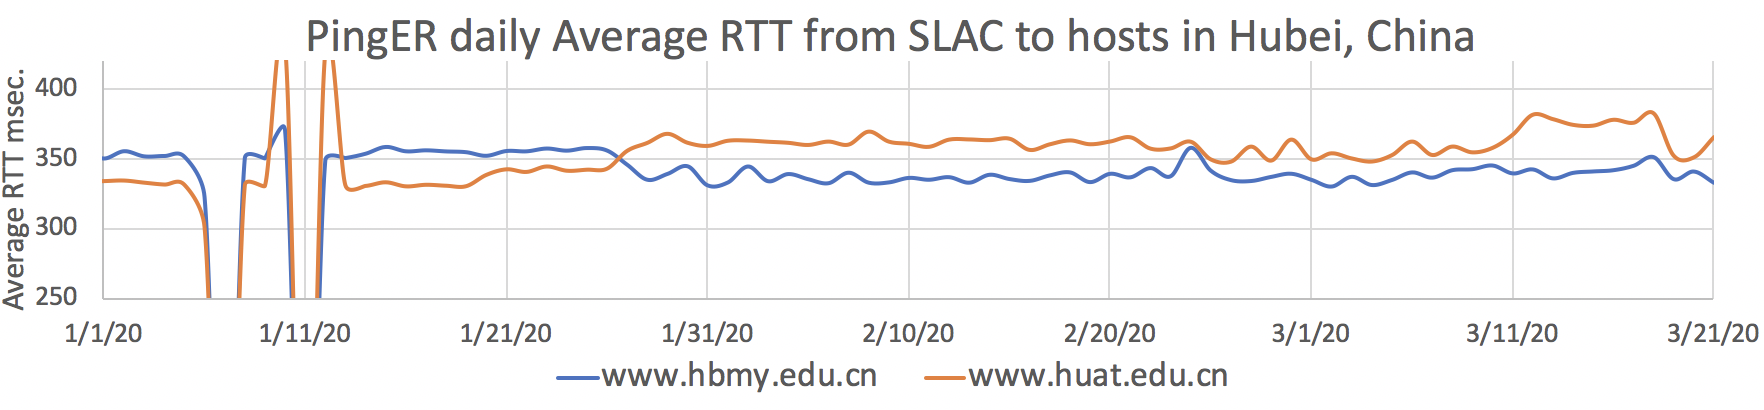
If we look at the daily aggregates for the packet loss per cent, average RTT and Inter Packet Delay Variation www.hbmy.edu.cn and www.hbuat.edu.cn from 3/23/2019 thru 3/21/2020 and then expand to see the subset from 1/1/2020 thru 3/21/2020 we get the plots below
 |  |
 |  |
 |  |
It is clear that there are huge variations in the measurements over the last year. Looking at just 2020 data there does appear to be evidence for an almost factor of 2 change in the IPDV towards the end of January, in opposite directions for the two hosts.
Looking at the aggregated monthly IPDVs for the two hosts we see:

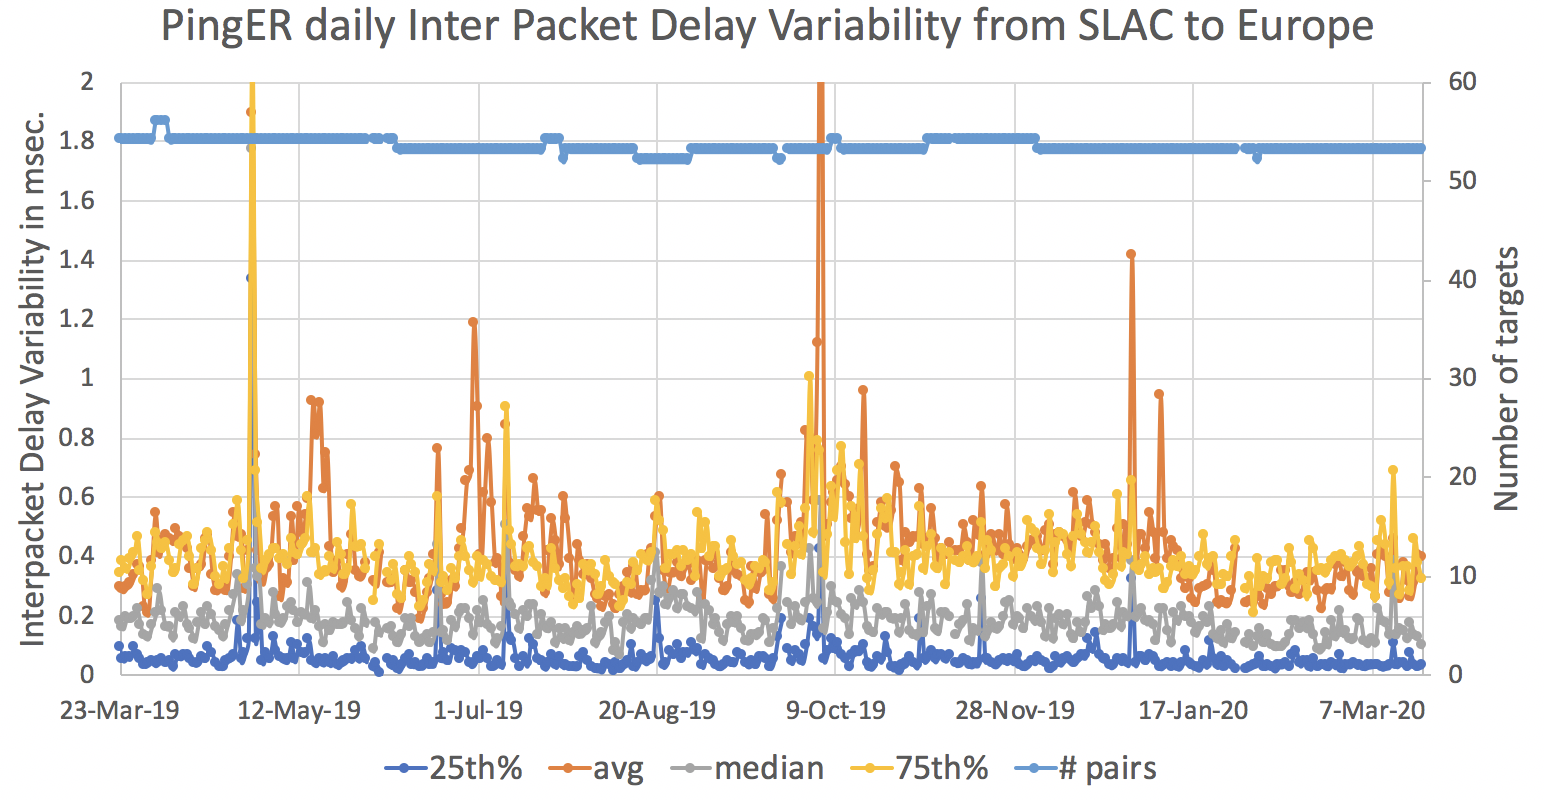
Europe
Italy jumped from three incidents on Friday, February 21 to 229 by the time of WHO’s February 25 situation report
For Italy, PingER monitors 7 hosts. They are in Bologna, Udine, Rome, Pisa and Frascati. These are not the hardest hit areas (see here).
After removing one (vr1dx.fisica.uniud.it) which stopped responding on February 20, 2020 the IPDV for each of the Italian hosts appears as below:

There appears to be a dramatic drop in the IPDV for the target host speed.unidata.it in Bologna between the end of January and Feb 19th. Italy's first COVID-19 case was announced February 19th, thus it is doubtful this drop has anything to do with COVID-19.
A lockdown began for Northern Italy on March 8th and extended to all Italy on March 9th. A plot of the daily IPDV measured from SLAC to 6 Italian hosts together with some COVID-19 milestones is shown below. The milestones are 17 cases diagnosed Feb 21 (including first local transmissions) and 225(105 new) Feb 25. The progress of COVID-1`6 in Italy can be seen here. There are 6 Italian hosts being monitored from SLAC the values shown are the 25%, median and 75% of the daily IPDV measured for the 6 hosts for the given days.

More Information.
Excel spreadsheet of daily PingER measurements.
| View file | ||||
|---|---|---|---|---|
|