...
A timeline for COVID-19 can be found here. Also looking at a map of how the COVID-19 travelled the world or the HealthMap one can see how and when various regions were impacted. Note that for Europe, US and Canada the Christmas/New Year season (end November thru 2nd week in January) may be expected to change behaviors.
...
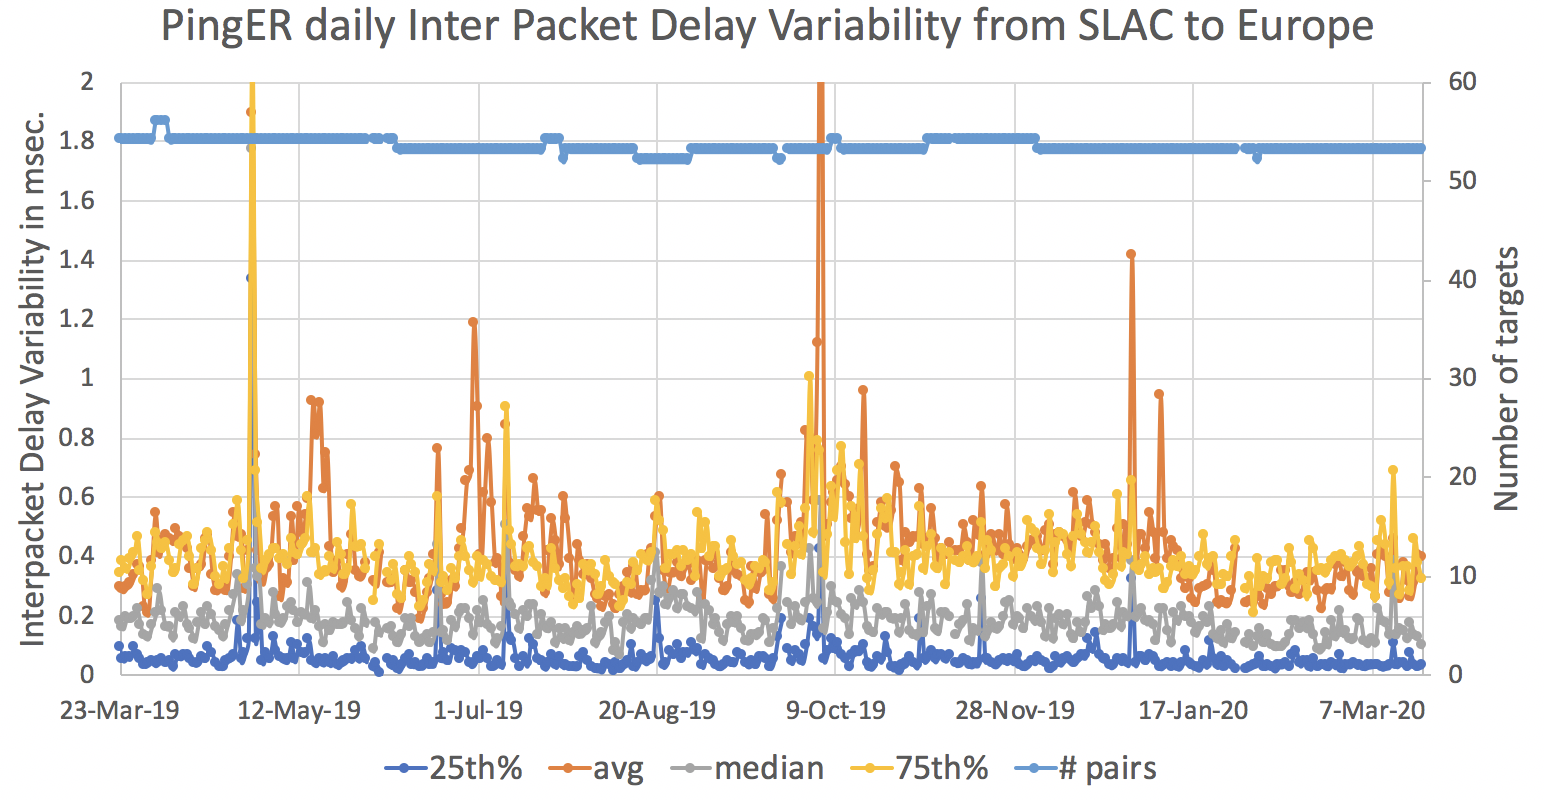
Looking at the Inter Packet Delay Variation (IPDV, ) a measure of the variability between adjacent ping packet RTTs there is some evidence that the variability reduced between 18th Jan and March 10th 2020. Whether this has anything to do with COVID19 I do not hazard a guess. I do note that the The first person in China to die of the COVID-19 virus was reported on January 10th, and by January 31st there were 9,720 cases in China. Looking in more detail at the Healthmap one sees
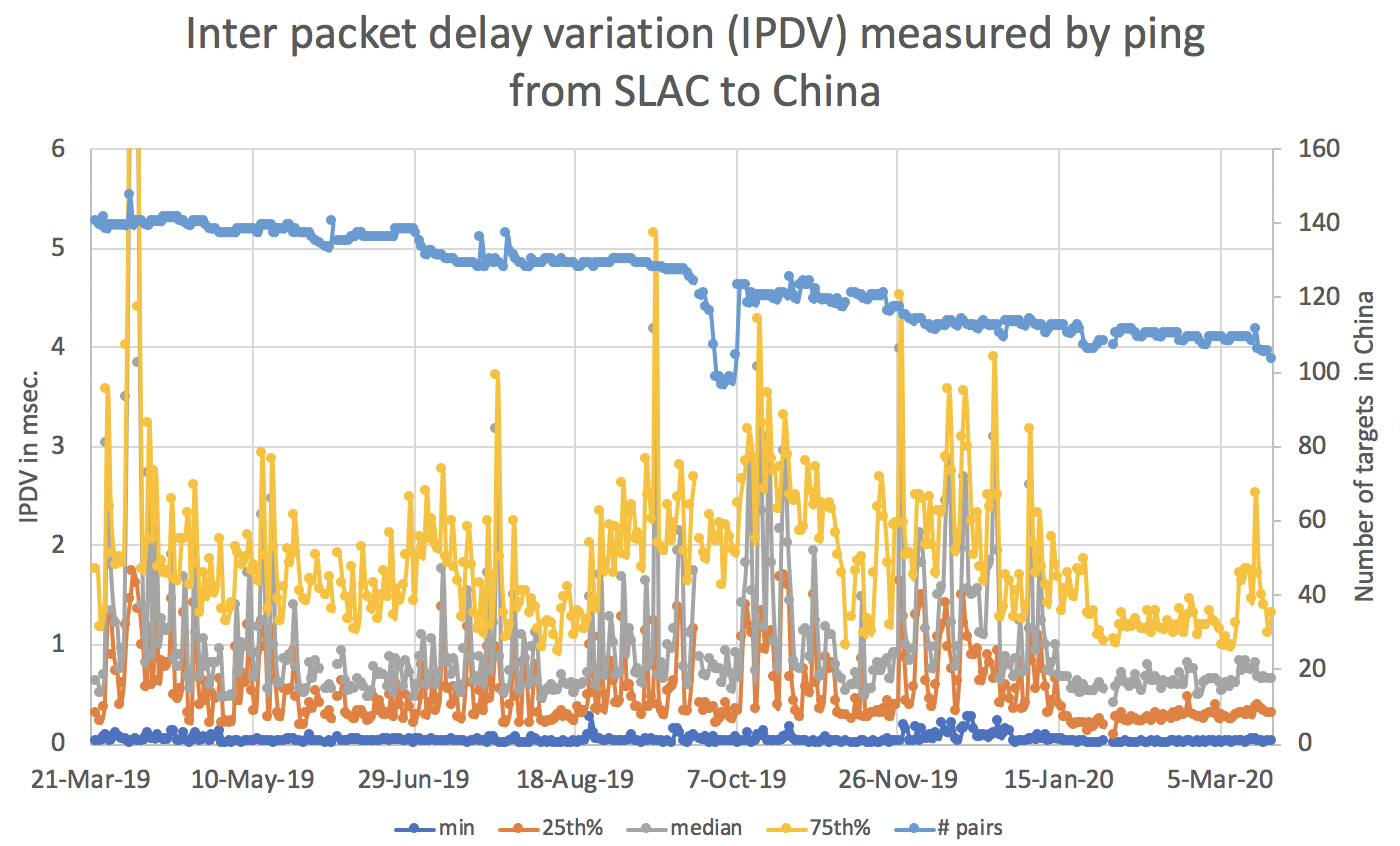
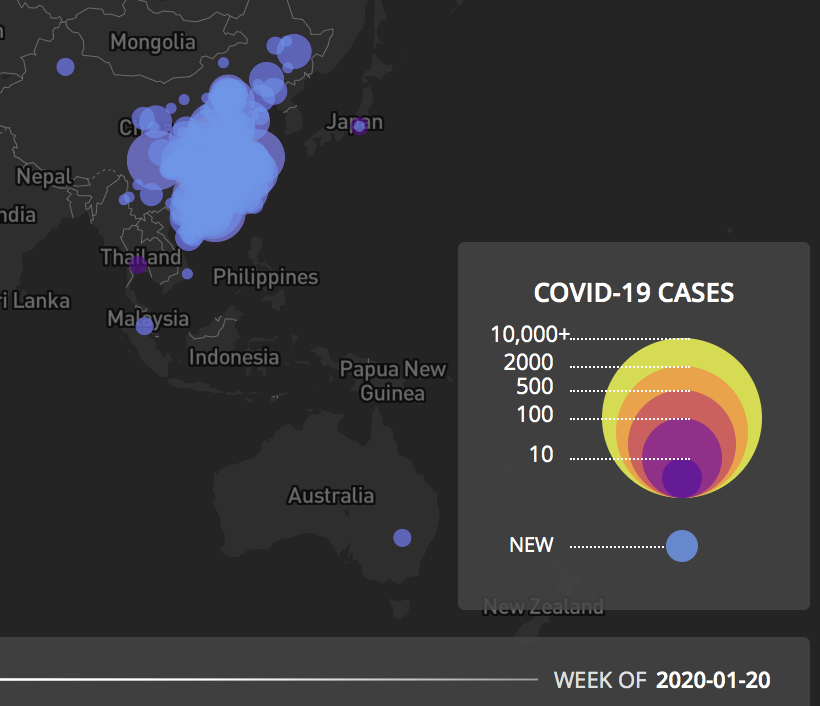
Looking in more detail at the Healthmap one sees the dramatic spread of the virus in China between January 13 and January 20, 2020. Thus the drop in IPDV RTTs may indeed be linked to the impact of the growth of COVID-19 infections in China.
| January 13, 2020 | January 20, 2020 |
|---|---|
 |  |
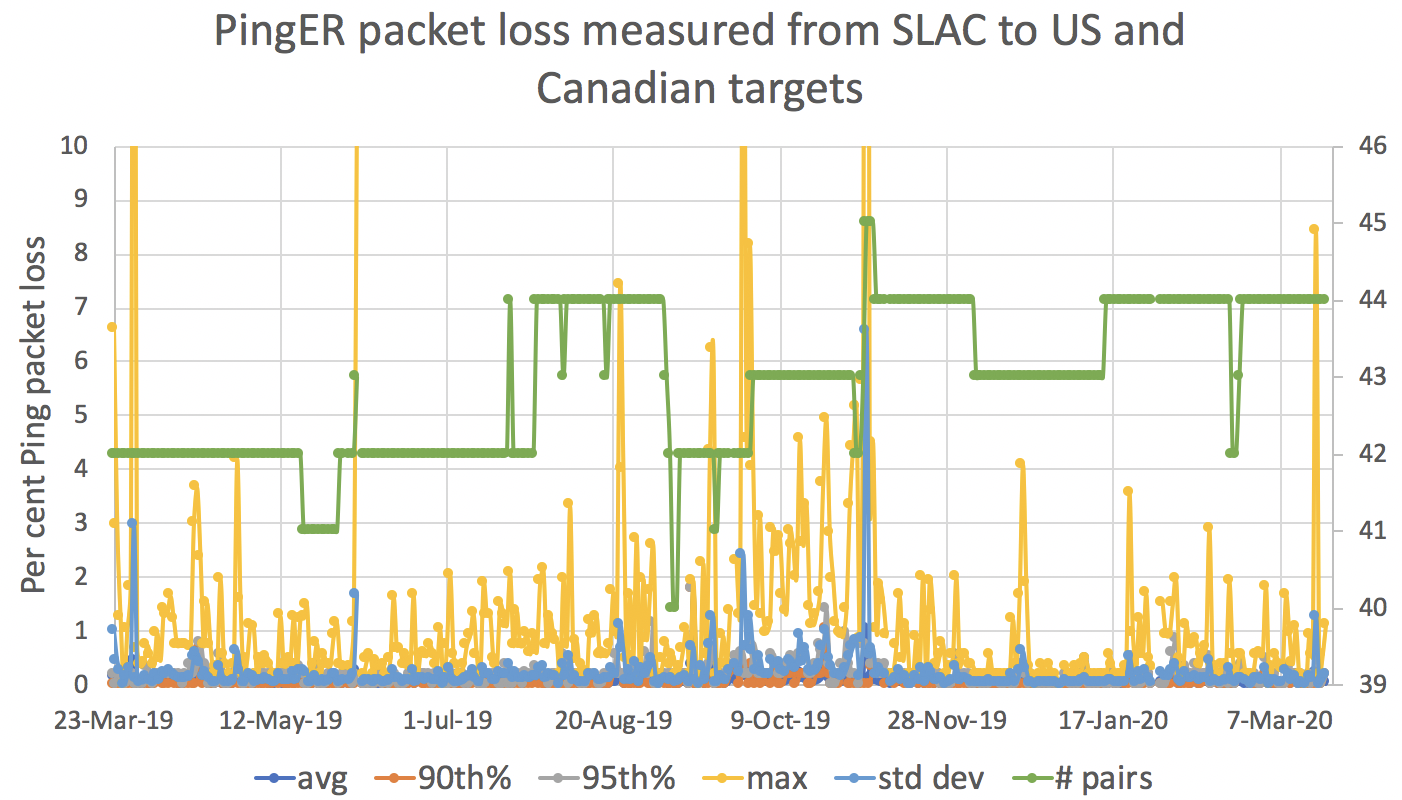
I can see nothing similar when looking at the US and Canada (N. America) IPDV data, maybe the effect is later in the evolution of the virus' impact.
...
For the US and Canada the losses are lower and usually 0% (typically >=90% of the targets show no losses), so instead we show the average maximum losses
PingER monitors one host two hosts in Hubei: www.hbmy.edu.cn (latitude 30.4918 longitude 114.3960) at at Hubei University for Nationalities , 39 Xueyuan Road, Enshi, Hubei Province, China. The hourly measurements are and Hubei University of Automotive Technology and www.huat.edu.cn at the Hubei University of Automotive Technology. The hourly measurements for www.hbmy.edu.cn are shown below (one can use the form https://www.slac.stanford.edu/cgi-bin/ping_data_plot.pl to create such a plot).
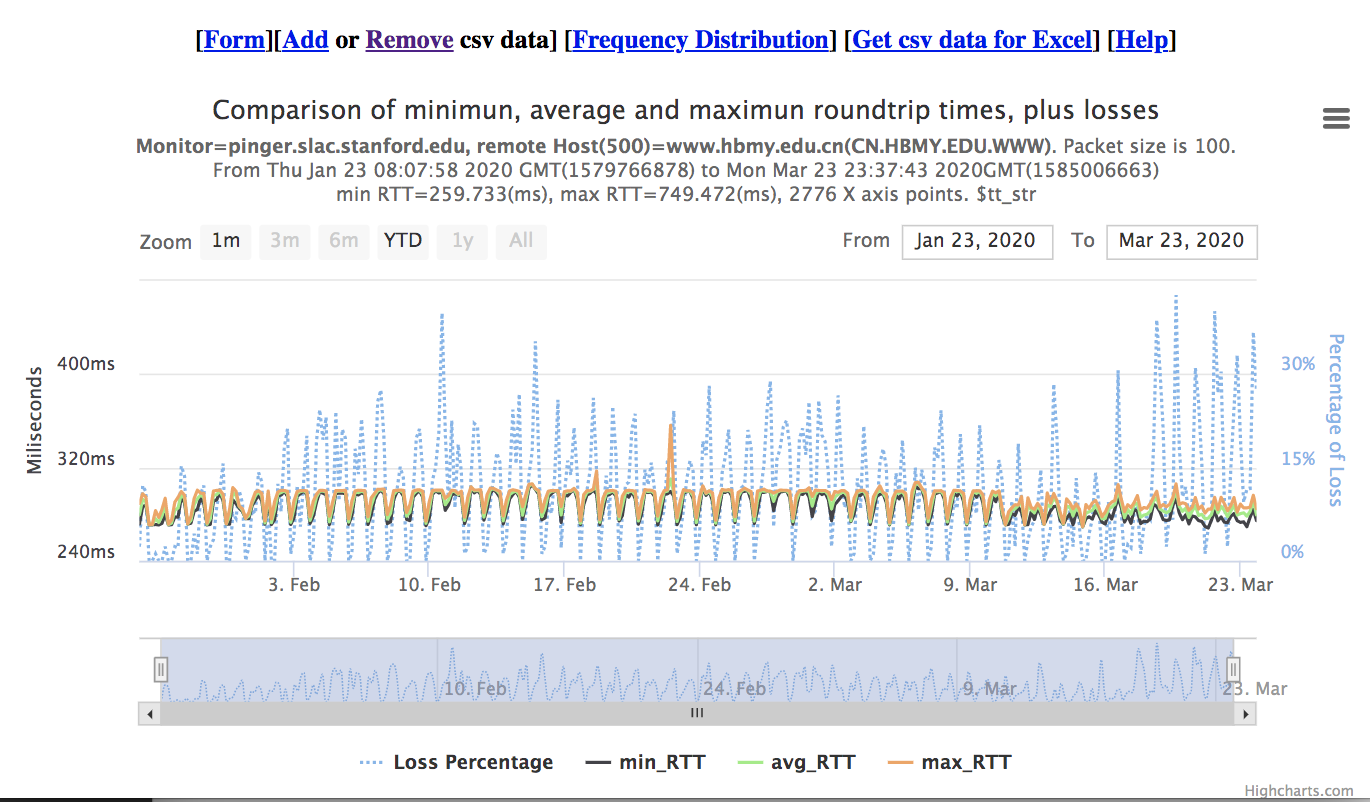
In general there are marked diurnal changes. There is a slight increase in RTTs following the Chinese New Year January 25th 2020. Then there is a small step reduction in RTTs following March 10, 2020, followed by an increase in the packet losses starting March 18th 2020.
| PingER average hourly RTT from SLAC to Hubei University for Nationalities | PingER percent hourly packet loss from SLAC to Hubei University for Nationalities |
 |  |
If we look at the daily aggregates for the packet loss per cent, average RTT and Inter Packet Delay Variation www.
...
hbmy.edu.cn and www.hbuat.edu.cn from 3/23/2019 thru 3/21/2020 and then expand to see the subset from 1/1/2020 thru 3/21/2020 we get the plots below
 | 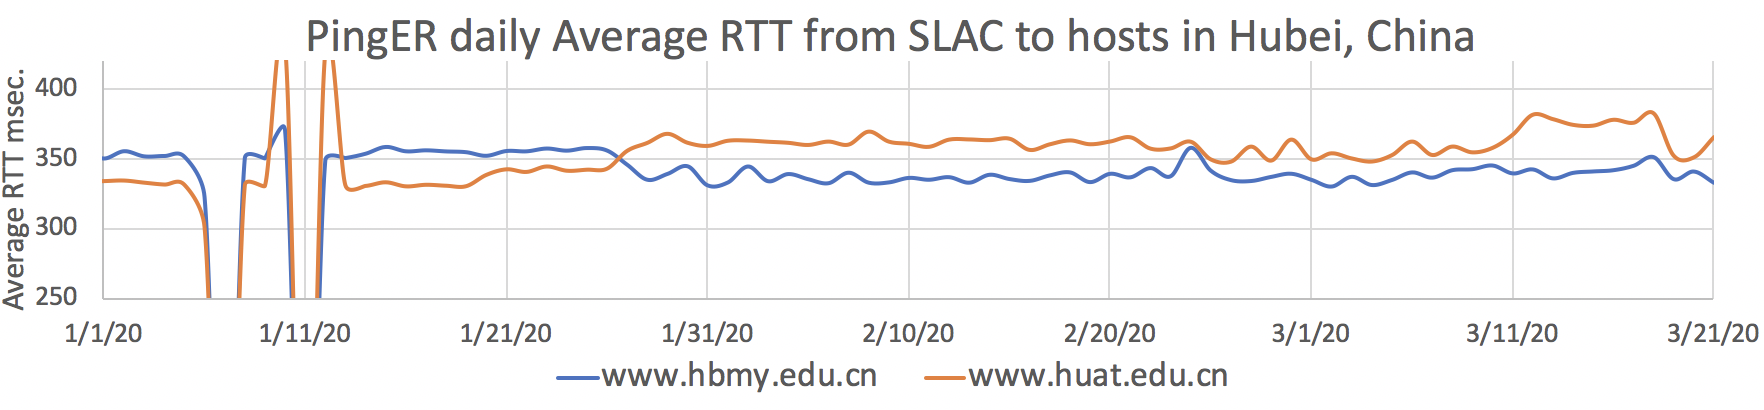 |
 | |
 |  |
It is clear that there are huge variations in the measurements over the last year. Looking at just 2020 data there does appear to be evidence for an almost factor of 2 change in the IPDV towards the end of January, in opposite directions for the two hosts.
Europe
For Italy, PingER monitors hosts 7 hosts. They are in Bologna, Udine, Rome, Pisa and Frascati. These are not the hardest hit areas (see here).
...