...
Currently I do not know why we see these bumps or what they are telling us.
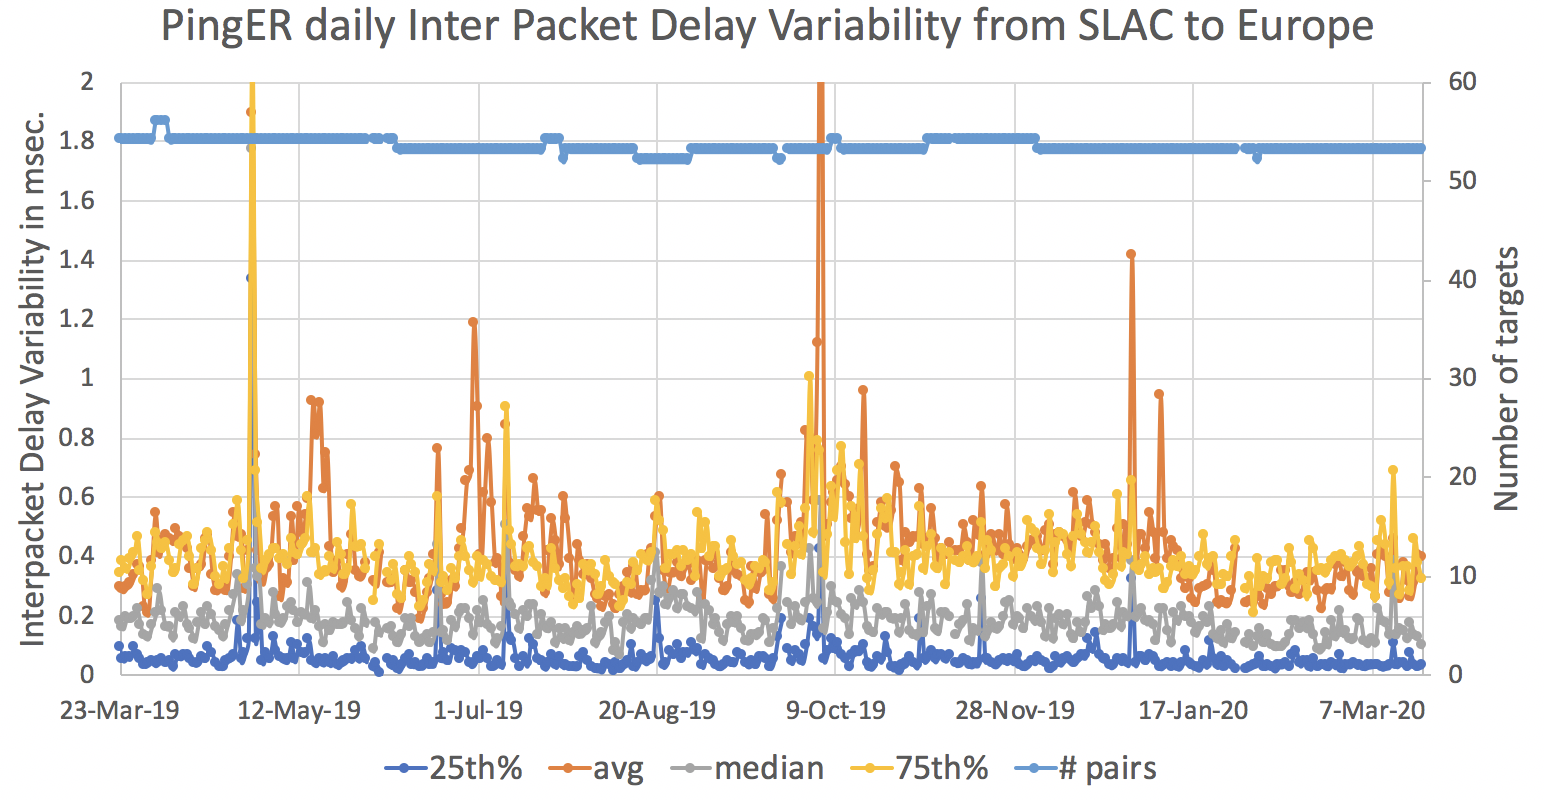
Looking at the Inter Packet Delay Variation (IPDV, ) a measure of the variability between adjacent ping packet RTTs there is some evidence that the variability reduced between 28th Jan and March 10th 2020. Whether this has anything to do with COVID19 I do not hazard a guess.
...
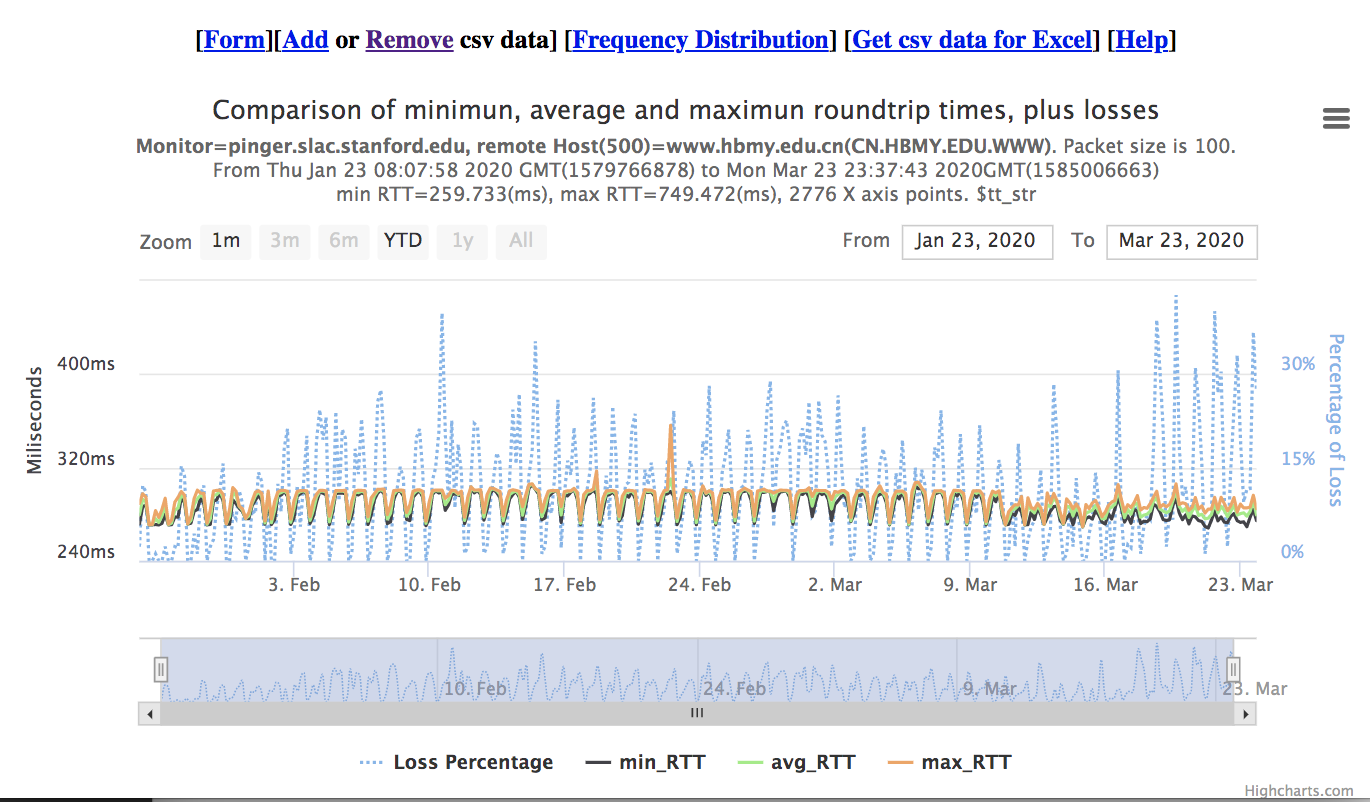
PingER monitors one host in Hubei: www.hbmy.edu.cn (latitude 30.4918 longitude 114.3960) at Hubei University for Nationalities, 39 Xueyuan Road, Enshi, Hubei Province, China. The hourly measurements are shown below (one can use the form https://www.slac.stanford.edu/cgi-bin/ping_data_plot.pl to create such a plot). In general there are marked diurnal changes. There is a slight increase in RTTs following the Chinese New Year January 25th 2020. Then there is a small step reduction in RTTs following March 10, 2020, followed by an increase in the packet losses starting March 18th 2020.
Europe
For Italy, PingER monitors hosts 7 hosts. They are in Bologna, Udine, Rome, Pisa and Frascati. These are not the hardest hit areas (see here).
More Information.
Excel spreadsheet of daily PingER measurements.
...