...
The phase curves of the pulsars are compared with the TimeProfile txt file used for the simulations. The ephemerides used are those included into PulsarDataList.txt file. The Reports are then generated with a ROOT macro that display displays phase curve, spectrum and skymap.
Al these data are also available at this URL
The gzipped event file is attached here
For barycentric decorrections I've used this fits file . It contains > 1 month of orbital spacecraft data and I've used also for other tests.
This is the skymap of the simulation used for this test:
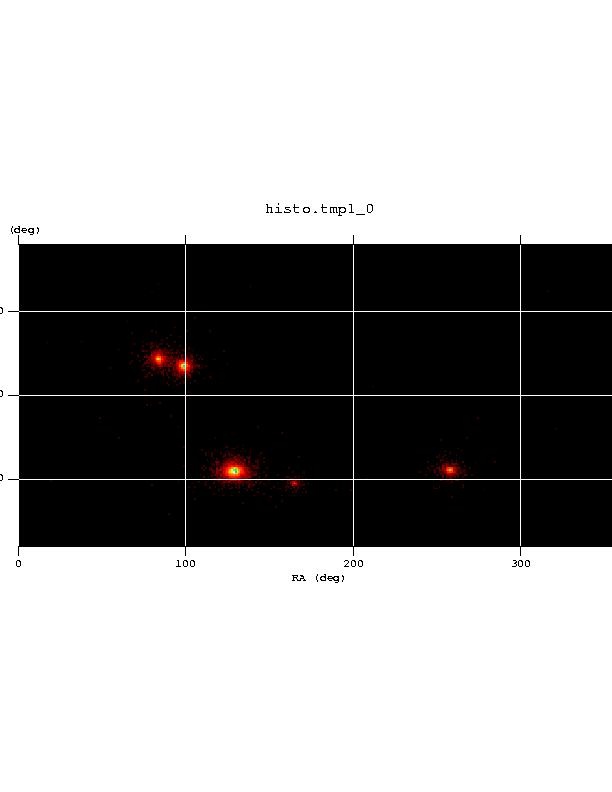 h2
h2
Vela and Crab Pulsars
The Vela TimeProfile is the one sent by S. Digel Seth in these pages. The ephemerides and parameters of the spectrum are the following (from Pulsarspectrum log file).
...
And this is the report for the Crab Pulsarpulsar:
Results on less luminous pulsars
Then I show here also the results for PSR1055-52, that have a smaller flux than Crab and Vela. Here the number of photons is smaller, but we see that the profile phase curve follows the TimeProfile used for simulation.
...
This tests shows that there is no remarkable differences between the TimeProfile used for simulation and the histogram of the phases after applying corrections with glbary and pulsePhase, provinding providing a good crosscheck between the simulation Tools and the analysis Tools.
...