Test made the April, 9th by Massimiliano Razzano
Test overview
In this test I've simulated the EGRET pulsars with PulsarSpectrum and then I've used glbary and pulsePhase to correct the arrival times for ephemerides and barycentric corrections. These are the versions of the tools used for this test:
Tool name |
Version |
|---|---|
ScienceTools |
v5r4p4 |
PulsarSpectrum |
v1r0p6 |
SpectObj |
v0r1p4 |
observationSim |
v5r6p6 |
glbary |
v0r1p2 |
pulsePhase |
v0r3p1 |
The phase curves of the pulsars are compared with the TimeProfile txt file used for the simulations. The ephemerides used are those included into PulsarDataList.txt file. The Reports are then generated with a ROOT macro that displays phase curve, spectrum and skymap.
Al these data are also available at this URL
The gzipped event file is attached here
For barycentric decorrections I've used this fits file . It contains > 1 month of orbital spacecraft data and I've used also for other tests.
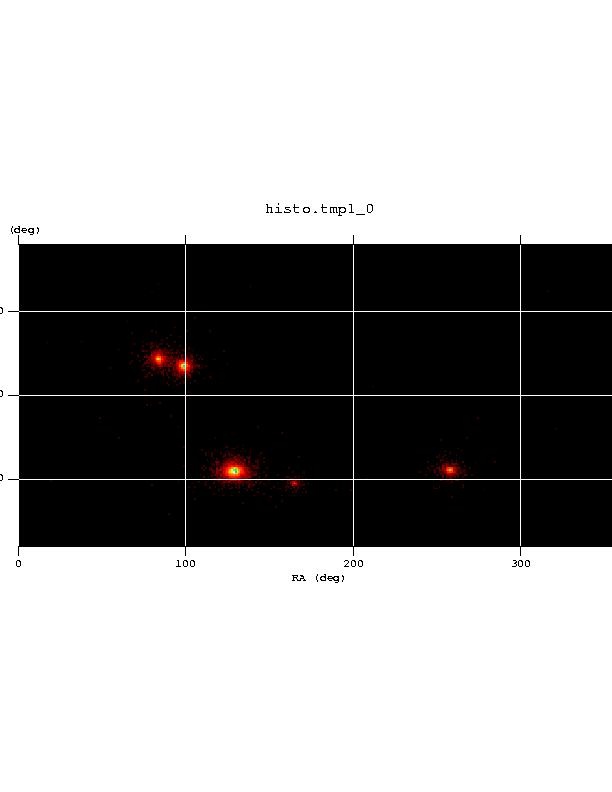
This is the skymap of the simulation used for this test:
Vela and Crab Pulsars
The Vela TimeProfile is the one sent by Seth in these pages. The ephemerides and parameters of the spectrum are the following (from Pulsarspectrum log file).
PulsarSpectrum Log for pulsarPSRVELA
Name : PSRVELA
Position : (RA,Dec)=(128.83,-45.18) ; (l,b)=(263.55,-2.79)
Flux above 100 MeV : 9e-06 ph/cm2/s
Number of peaks : 3
Epoch (MJD) : 54095
Phi0 (at Epoch t0) : 0.03
Period : 0.089 s. | f0: 11.236
Pdot : 2e-15 | f1: -2.52493e-13
P2dot : 2e-20 | f2: -2.52493e-18
Enphmin : 100000 keV | Enphmax: 3e+08 keV
Mission started at (MJD) : 54101 (212034369600 sec.) - Jan,1 2007 00:00.00 (TT)
Model chosen : 1 --> Using Phenomenological Pulsar Model
Effective Area set to : 1.21 m2
Random seed for the model : 61243
Spectrum parameters:
En = 1e+06 | E0 = 8e+06
G1 = -1.62 | b = 1.7
enphmin 100000 enphmax 3e+08
Normalisation between 100000 keV and 3e+07 keV
Photon extraction between 100000 keV and 3e+08 keV
Spectrum calculated between 100000 keV and 3e+08 keV
This is the test report which compare the original TimeProfile used for the simulation (red) with the reconstructed photons
For the Crab we used these parameters:
PulsarSpectrum Log for pulsarPSRCRAB
Name : PSRCRAB
Position : (RA,Dec)=(83.64,22.01) ; (l,b)=(184.56,-5.78)
Flux above 100 MeV : 2.265e-06 ph/cm2/s
Number of peaks : 3
Epoch (MJD) : 54098
Phi0 (at Epoch t0) : 0.02
Period : 0.033 s. | f0: 30.303
Pdot : 4.22e-13 | f1: -3.87511e-10
P2dot : 1e-19 | f2: -9.18175e-17
Enphmin : 100000 keV | Enphmax: 2e+07 keV
Mission started at (MJD) : 54101 (212034369600 sec.) - Jan,1 2007 00:00.00 (TT)
Model chosen : 1 --> Using Phenomenological Pulsar Model
Effective Area set to : 1.21 m2
Random seed for the model : 61443
Spectrum parameters:
En = 1e+06 | E0 = 3e+07
G1 = -2.08 | b = 2
enphmin 100000 enphmax 3e+07
Normalisation between 100000 keV and 3e+07 keV
Photon extraction between 100000 keV and 3e+07 keV
Spectrum calculated between 100000 keV and 3e+07 keV
And this is the report for the Crab pulsar:
Results on less luminous pulsars
Then I show here also the results for PSR1055-52, that have a smaller flux than Crab and Vela. Here the number of photons is smaller, but we see that the phase curve follows the TimeProfile used for simulation.
PulsarSpectrum Log for pulsarPSR1055-52
Name : PSR1055-52
Position : (RA,Dec)=(164.49,-52.45) ; (l,b)=(285.98,6.65)
Flux above 100 MeV : 2.19e-07 ph/cm2/s
Number of peaks : 3
Epoch (MJD) : 54100
Phi0 (at Epoch t0) : 0.12
Period : 0.197 s. | f0: 5.07614
Pdot : 5.8e-15 | f1: -1.4945e-13
P2dot : 3.2e-19 | f2: -8.24551e-18
Enphmin : 100000 keV | Enphmax: 2e+07 keV
Mission started at (MJD) : 54101 (212034369600 sec.) - Jan,1 2007 00:00.00 (TT)
Model chosen : 1 --> Using Phenomenological Pulsar Model
Effective Area set to : 1.21 m2
Random seed for the model : 3678
Spectrum parameters:
En = 1e+06 | E0 = 2e+07
G1 = -1.8 | b = 2
enphmin 100000 enphmax 3e+07
Normalisation between 100000 keV and 3e+07 keV
Photon extraction between 100000 keV and 3e+07 keV
Spectrum calculated between 100000 keV and 3e+07 keV
The following is the report for this pulsar:
Conclusions
This tests shows that there is no remarkable differences between the TimeProfile used for simulation and the histogram of the phases after applying corrections with glbary and pulsePhase, providing a good crosscheck between the simulation Tools and the analysis Tools.
April, 21th, by Massimiliano Razzano