...
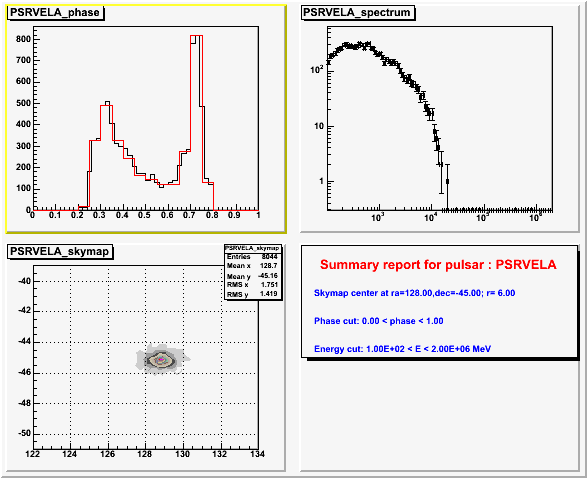
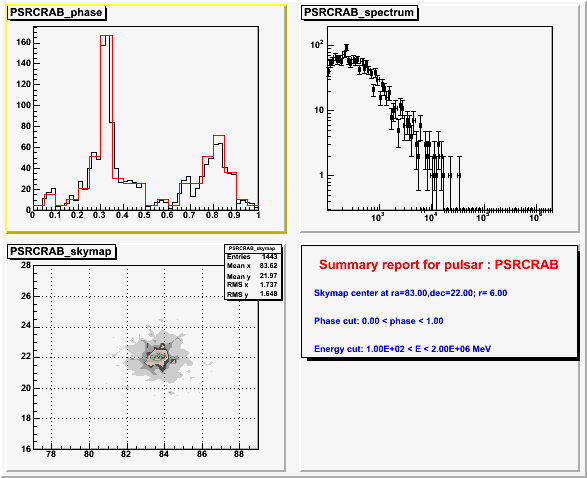
This is the test report which compare the original TimeProfile used for the simulation (red) with the reconstructed photons
Report image
For the Crab we used these parameters:
PulsarSpectrum Log for pulsarPSRCRAB
Name : PSRCRAB
Position : (RA,Dec)=(83.64,22.01) ; (l,b)=(184.56,-5.78)
Flux above 100 MeV : 2.265e-06 ph/cm2/s
Number of peaks : 3
Epoch (MJD) : 54098
Phi0 (at Epoch t0) : 0.02
Period : 0.033 s. | f0: 30.303
Pdot : 4.22e-13 | f1: -3.87511e-10
P2dot : 1e-19 | f2: -9.18175e-17
Enphmin : 100000 keV | Enphmax: 2e+07 keV
Mission started at (MJD) : 54101 (212034369600 sec.) - Jan,1 2007 00:00.00
(TT)
Model chosen : 1 --> Using Phenomenological Pulsar Model
Effective Area set to : 1.21 m2
...
And this is the report for the Crab Pulsar:
Results on less luminous pulsars
Then I show here also the results for PSR1055-52, that have a smaller flux than Crab and Vela. Here the number of photons is smaller, but we see that the profile follows the TimeProfile used for simulation.
PulsarSpectrum Log for pulsarPSR1055-52
Name : PSR1055-52
Position : (RA,Dec)=(164.49,-52.45) ; (l,b)=(285.98,6.65)
Flux above 100 MeV : 2.19e-07 ph/cm2/s
Number of peaks : 3
Epoch (MJD) : 54100
Phi0 (at Epoch t0) : 0.12
Period : 0.197 s. | f0: 5.07614
Pdot : 5.8e-15 | f1: -1.4945e-13
P2dot : 3.2e-19 | f2: -8.24551e-18
Enphmin : 100000 keV | Enphmax: 2e+07 keV
Mission started at (MJD) : 54101 (212034369600 sec.) - Jan,1 2007 00:00.00 (TT)
Model chosen : 1 --> Using Phenomenological Pulsar Model
Effective Area set to : 1.21 m2
Random seed for the model : 3678
Spectrum parameters:
En = 1e+06 | E0 = 2e+07
G1 = -1.8 | b = 2
enphmin 100000 enphmax 3e+07
Normalisation between 100000 keV and 3e+07 keV
Photon extraction between 100000 keV and 3e+07 keV
Spectrum calculated between 100000 keV and 3e+07 keV
The following is the report for this pulsar:
Conclusions
This tests shows that there is no remarkable differences between the TimeProfile used for simulation and the histogram of the phases after applying corrections with glbary and pulsePhase, provinding a good crosscheck between the simulation Tools and the analysis Tools. IMAGE

