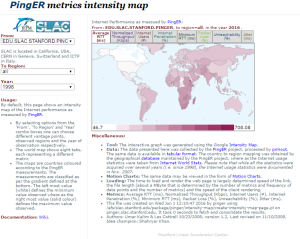
Data Explorer also here
Motion charts


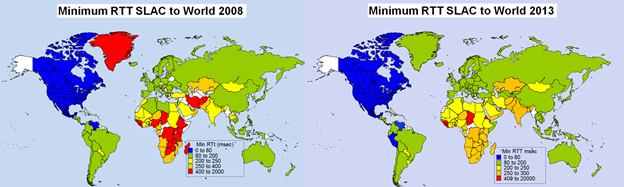
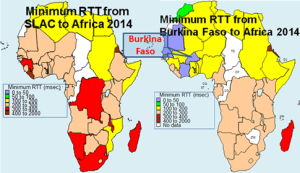
Maps

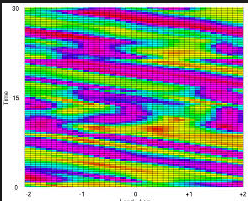
 Color =loss, height=RTT with median and jitter, color=throughput (or MOS)
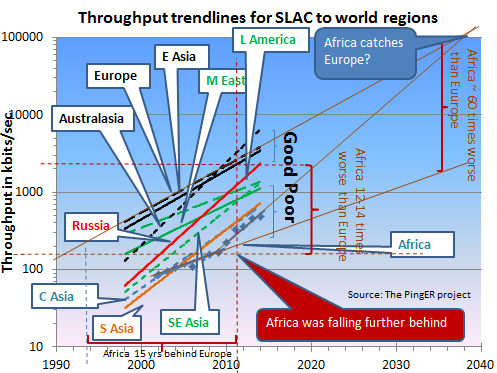
Trendlines
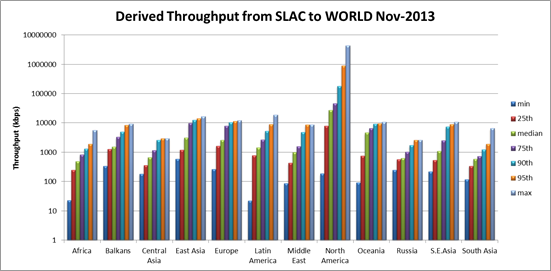
Percentiles
 ,
, 
Multiple source and destinations
...
Also with multiple y scales (not just 2)
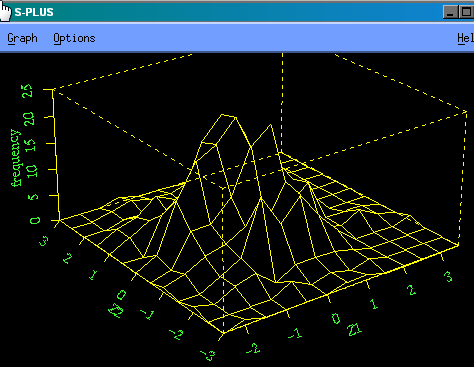

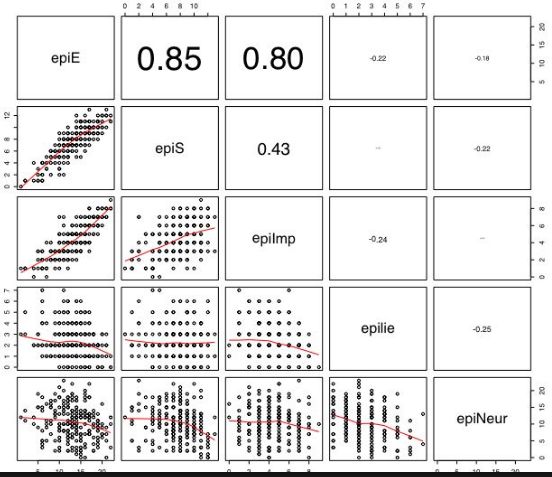
S-Plus brush function
Correlations