Page History
...
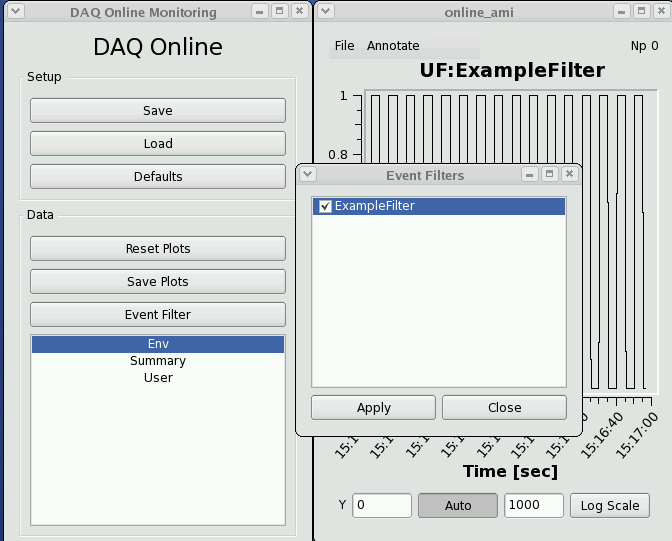
"Restart DAQ" and "Restart Monitoring" icons on operator console bring up multiple GUI panels for DAQ system. Online Monitoring GUI is as shown below:

A list of primary event displays is shown in the Data panel of the DAQ Online Monitoring window. This list reflects various detectors involved in the current run of the experiment. A mouse click on specific event display will open up a corresponding data monitoring plot. Each type of data plot has multiple features attched to it which will be covered in following section.The Online Monitoring GUI is shown below:
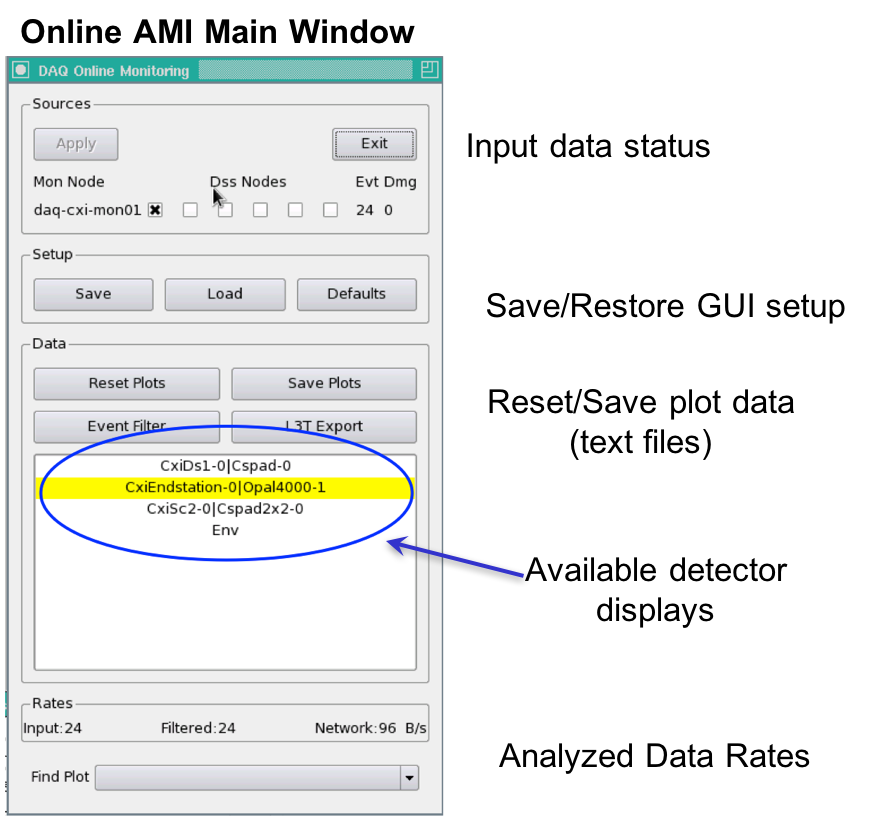
Sources: The Sources panel allows the user to map which monitoring nodes receive events destined for a specific DSS node. In the example above, daq-cxi-mon01 will see the same data that is being recorded by daq-cxi-dss01.
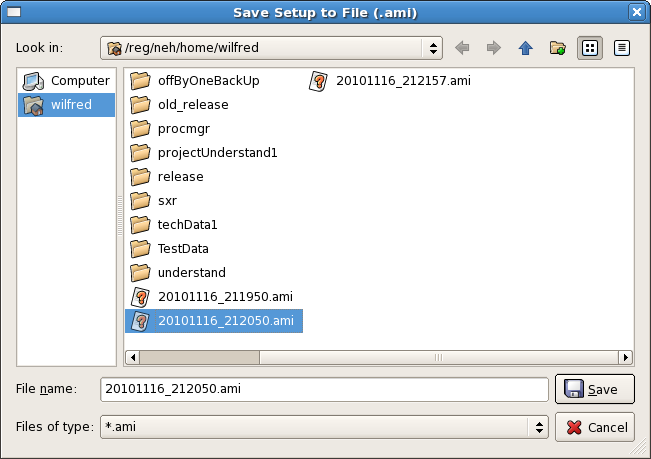
Setup: The Setup panel allows the user to save various display windows and to load a saved setup from a file. "Setup : This section deals with setting up various display windows for online monitoring. "Save" control provides a way to archive configuration of current display windows. (X-Y plots, 2-D frame etc.) Whereas, "Load" control retrives existing display windows configuration. Display configuration is saved in file with extension ".ami" as shown in following figure.
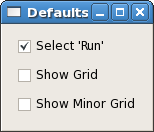
"Defaults" control button provides users a feature to set specific settings (show grid/minor grid etc.) of online monitoring plots as default.
Data: This section provides various features for data in various plots. The Data panel shows operations that can be applied to all plots (all data), such as resetting them, applying an event filter, or saving plots. "Reset Plots" control will reset the all displayed plots by clearing their content and restart ploting plotting with a new set of data. Users can save plots using the "Save Plots" control button available in this section. Plot data will be saved as a ".dat" file in terms of values associated with its axis.
...
| No Format |
|---|
1.5e-09 0.000561523 2.5e-09 0.000170898 3.5e-09 0.000170898 4.5e-09 0.000366211 5.5e-09 -0.000195313 6.5e-09 0.000268555 7.5e-09 7.32422e-05 8.5e-09 0.000366211 9.5e-09 7.32422e-05 1.05e-08 7.32422e-05 : : : |
List of primary event displays is shown at the bottom part of the "Online Monitoring Window". This list reflects various detectors involved in current run of experiment. A mouse click on specic event display will openup corresponding data monitoring plot. Each type of data plots has multiple features attched to it which will be covered in following section.
Rates: The Rates panel at the bottom shows the effective input data rate to AMI and the network bandwidth. The Find Plot button helps a user to bring a specific plot to the foreground.
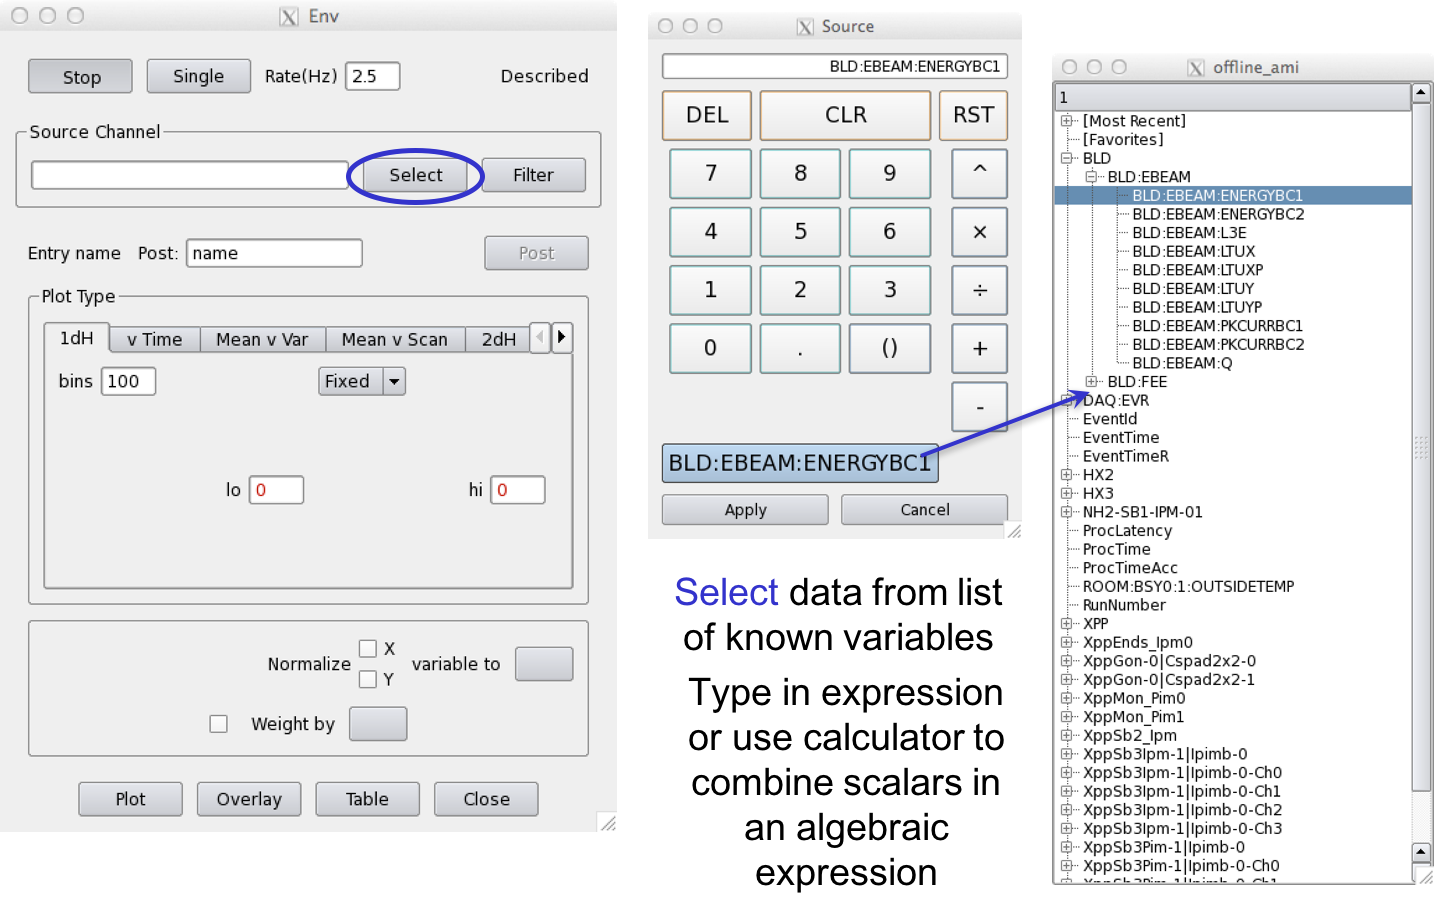
Env Window: Choose Data to Plot
Env or Environment data is all scalar data associated with the event. This includes Event Receiver data, Beamline Data such as the beam energy, phase cavity, and FEE Gas Detector quantities, diode readout values, encoder readout, EPICS variables included in the DAQ data stream, and Posted data, processed detector data for this event (set up elsewhere).
Examples 
Details of Scalar variables/data
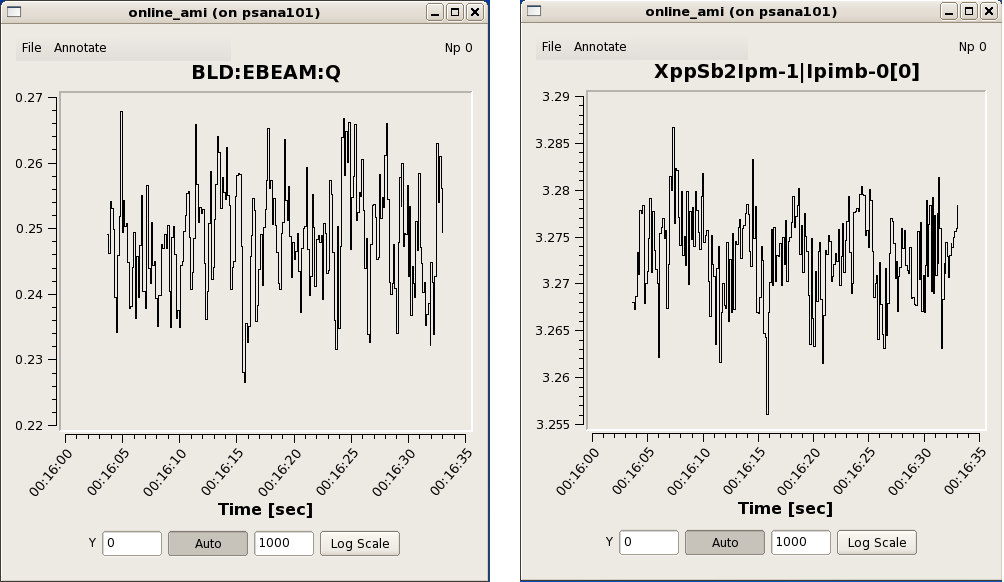
Ebeam and Ipimb data view details
...
| Anchor | ||||
|---|---|---|---|---|
|
Writing a plug-in to the Online Monitoring GUI
The core online monitoring can be specialized by supplying plug-in modules containing user code. These modules can
(1) compute variables to be used in the monitoring GUI,
(2) generate additional plots to be displayed, and
(3) provide a filtering decision for events to be used in the monitoring.
...
| Anchor | ||||
|---|---|---|---|---|
|
Writing a user application (reads from shared memory)
| Anchor | ||||
|---|---|---|---|---|
|
Online Monitoring and Simulation Using Files
The online monitoring system will interface the DAQ system to the monitoring software through a shared memory interface. The two sides communicate with each other via POSIX message queues. The DAQ system will fill the shared memory buffers with events which are also known as transitions. The DAQ system notifies the monitoring software that each buffer is ready by placing a message in the monitor output queue containing the index of the newly available event buffer.
...
Overview
Content Tools