...
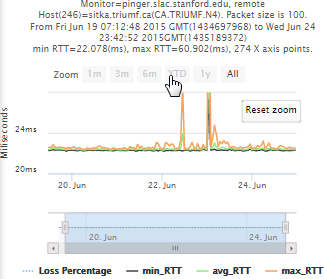
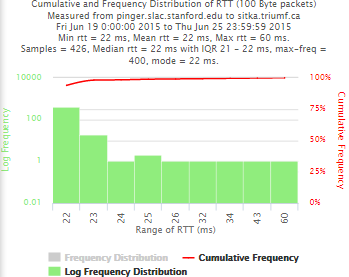
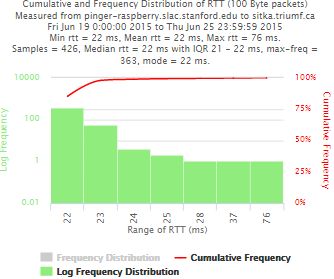
Example target sitka.triumf.ca (~22msec.)
For 100Byte the round trip time series for RTTs did not have similar behaviour. We noticed a great change mainly in the maximum round trip time. The average em minimum RTT did not change that much. Another point about pinger-raspberry is that it increases significantly the RTT for near nodes (about ~1ms). The difference is greater than if we compare a node which is in a long distance.
| Time series | Frequency distributions |
|---|---|
Example between pinger.slac.stanford.edu and pinger-
...
raspberry.slac.stanford
...
.edu
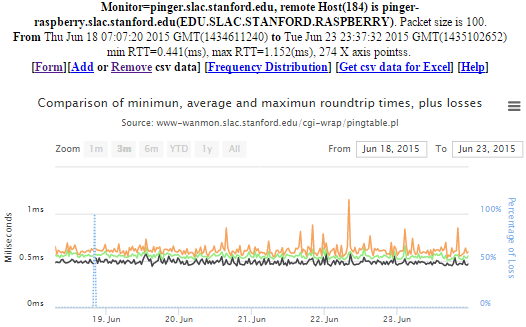
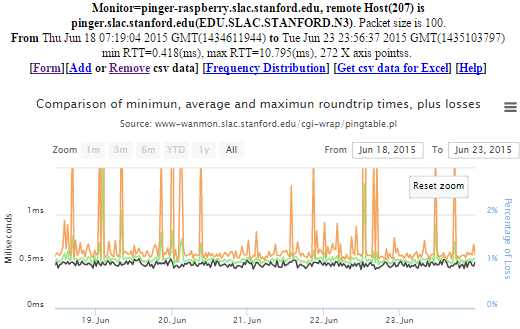
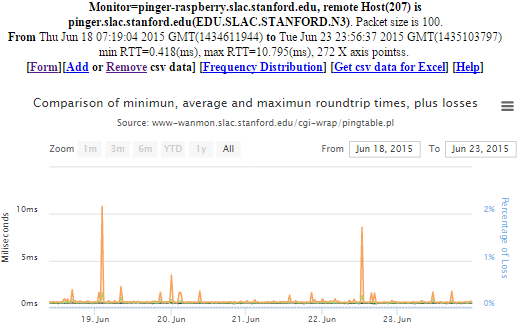
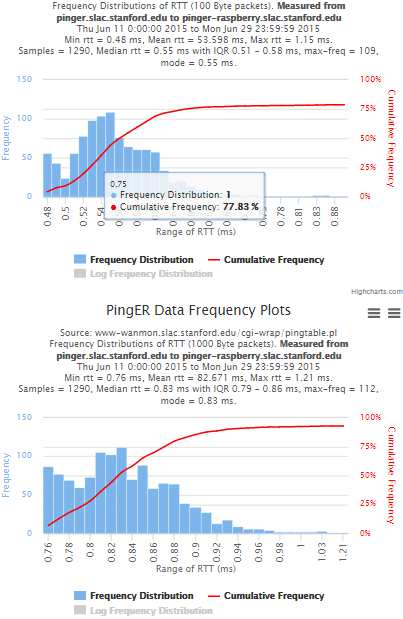
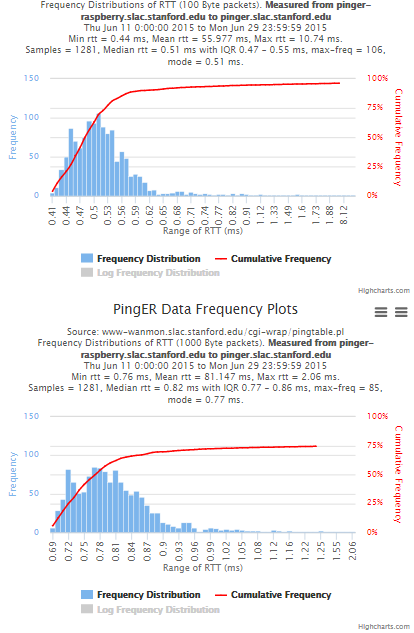
Now, we compared the RTT between pinger and pinger-raspberry. They are located in the same network and the RTT should be very small. However, as noticed before pinger-raspberry has a greater maximum RTT than pinger. The average RTT also has some difference, but now as much as the maximum time has. Note that the second graph represents the third graph using the same scale as the first (pinger graph).
| pinger to Pinger-raspberry | pinger-raspberry to pinger |
|---|---|
Kolmogorov-Smirnov Test
The Kolmogorov-Smirnov test (KS-test) tries to determine if two datasets differ significantly. The KS-test has the advantage of making no assumption about the distribution of data. In other words it is non-parametric and distribution free. The method is explained here and makes use of an Excel tool called "Real Statiscs". The tests were made using the raw data and distributions, both methods had similar results except for the 100Bytes Packet that had a great difference in the results. The results using raw data says both samples does not come from the same distribution with a significant difference, however if we use distributions the result says that only the 1000Bytes packet does not come from the same distribution. Bellow you will find the graphs for the distributions that were created and the cumulative frequency in both cases plotted one above other (in order to see the difference between the distributions).
