...
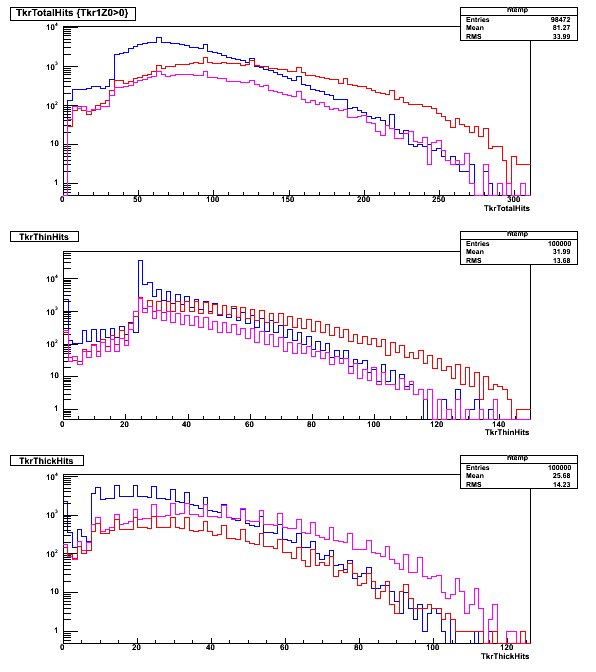
produced in the upstream material, whose thickness is underestimated in the current simulation. The figure below compares the distributions for a an early 5 GeV-electron run with the second armseco nd arm (thickness greater than 10% X0)
of the spectrometer sitting in the beam amounting to more 10% X0 (red, run 811), for a more recent run with the arm out of the beam (purple, run 916) and for the Monte-Carlo simulation (blue, run 122).
The three panels correspond to total hit multiplicity (top), hit multiplicity for thin (middle) and thick layers (bottom). The beam is 5 GeV electronsA better agreement, although still unsatisfactory, with the MC simulation prediction is found for the recent run with less upstream material on the line. Effort is being made to reduce this material as much as possible.
