Page History
...
Package PlotsWithGUI is intended for interactive 2-d image analysis. It is written on python and uses the numpy library for fast manipulation with arrays, matplotlib library for graphics, and PyQt4 for GUI (Graphical User Interface). We assume that image is available in the form of 2-d numpy array. This array is passed as an input parameter at initialization of the ImgExplorer class object and can be updated later using a simple program interface. When image is drawn, one may select by mouse different regions of the image in order to plot spectra, profiles, x-y and r-theta projections, zoomed-in images etc. GUI allows easy manipulate with regions; add, move, select, and remove regions and associated derived plots for current eventimage. All newly created plots are preserved for other eventsimages, when image array is updated. GUI is mainly based on intuitive mouse manipulations with very minor input from keyboard, where it is necessary.
...
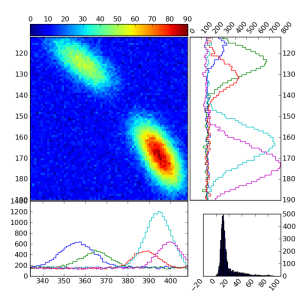
Plot shows the zoomed rectangular region of image, its two projections on x and y directions, and the spectrum of pixel amplitudes in the same rectangle. The number of slices in x and y projection can be changed trough the Proj.X-Y GUI.
Projection R-
...
Phi
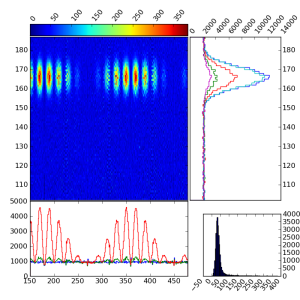
For this plot the wedge region of image is transformed in the r-theta array. Plot shows the r-theta array, its two projections on r and theta directions, and the spectrum of the bin amplitudes. The number of r-rings and theta-sectors can be changed trough the GUI. The radial correction factor r0/r can be applied to the pixel amplitudes if the checkbox is marked in the Proj.R-ThetaPhi GUI.
Zoom
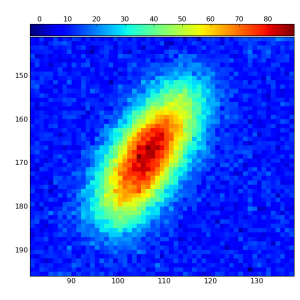
Plot shows the zoomed rectangular region of image.
...
Overview
Content Tools