Page History
...
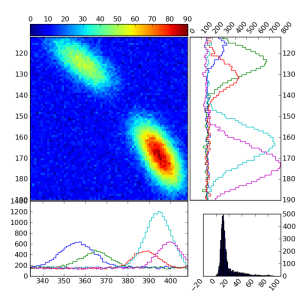
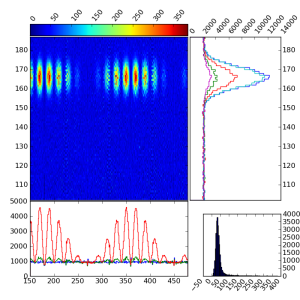
Plot shows the zoomed rectangular region of image, its two projections on x and y directions, and the spectrum of pixel amplitudes in the same rectangle. The number of slices in x and y projection can be changed trough the Proj.X-Y GUI.
Projection R-Theta
For this plot the wedge region of image is transformed in the r-theta array. Plot shows the r-theta array, its two projections on r and theta directions, and the spectrum of the bin amplitudes. The number of r-rings and theta-sectors can be changed trough the GUI. The radial correction factor r0/r can be applied to the pixel amplitudes if the checkbox is marked in the Proj.R-Theta GUI.
Zoom
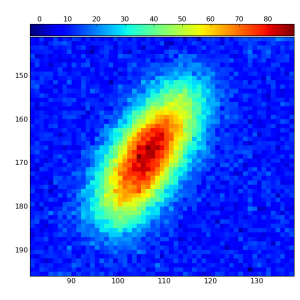
Plot shows the zoomed rectangular region of image.
...
The event access method get_image( self, imageFlag, increment=None), defined in class ImgControl needs to be owerwritten in order to supply user-defined image arrays, as it is shown in Example for multi-image analysis. The input parameter imageFlag may take 3 values self.icp.imagePrevious, self.icp.imageCurrent, or self.icp.imageNext, depending on which button in the GUI is clicked, left arrow, Current, or right arrow, respectively. The increment value, also defined in the GUI, may be used as a parameter in transition to the next or previous image.
...
Buttons Print and Save in the GUI works work with configuration parameters;
...
Overview
Content Tools