...
Going to http://www-wanmon.slac.stanford.edu/cgi-wrap/connectivity.pl?format=csv&rawdata=pinger.usindh.edu.pk&days=6&monitor=pinger.pern.edu.pk and http://www-wanmon.slac.stanford.edu/cgi-wrap/connectivity.pl?format=csv&rawdata=pingerjms.pern.edu.pk&days=6&monitor=pinger.pern.edu.pk we collected the data for past 7 days and plotted it in excel to see the curves for Average RTT and Min RTT.
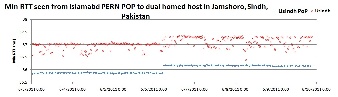
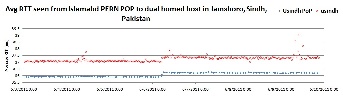
And the spreadsheet is available hereLooking at the graphs one can see that there are rapid fluctuations in the data values for each node. Because of which the graphs show a scattered plot with a number of data points above and below, which seem to be on the same point on x-axis. However looking at the spreadsheet, it is observed that two data values are collected for each half an hour, and these two values fluctuate by about 0.3 ~ 0.4 ms for PoP node while it fluctuates by 0.63ms for usndh non-PoP node. Although we don't know the reason for this fluctuation , however we know that this fluctuation is continuous for both of the nodes and for all 7 of the days.
We see that the min of min RTT for PoP was 35.827ms , avg of min RTT was 36.164, max of min RTT was 36.48, IQR of min RTT was 0.294 (see table for pingerjms.pern.edu.pk column 1 and 2).
...
Extra hops can be seen in Usindh traceroute (hop 6 and 7). For both of the nodes, it takes 36.105 ~ 36.4 ms to reach the hop khi77.pie.net.pk, however, as the hops are increased for accessing usindh , an increased RTT of 0.9 ms is observed. This is a small difference in RTT for the two nodes . This difference can be due to temporary congested network and long queueswhich is added due to two extra hops and it supports the results shown above in graphs.
Comparison of Khi-PoP and Neduet
...