Jeremy's overview and how-to-install and run
HPS Remote Shifts
Expert JLAB-specific instructions
Structure of web-app and what to look for in monitoring plots
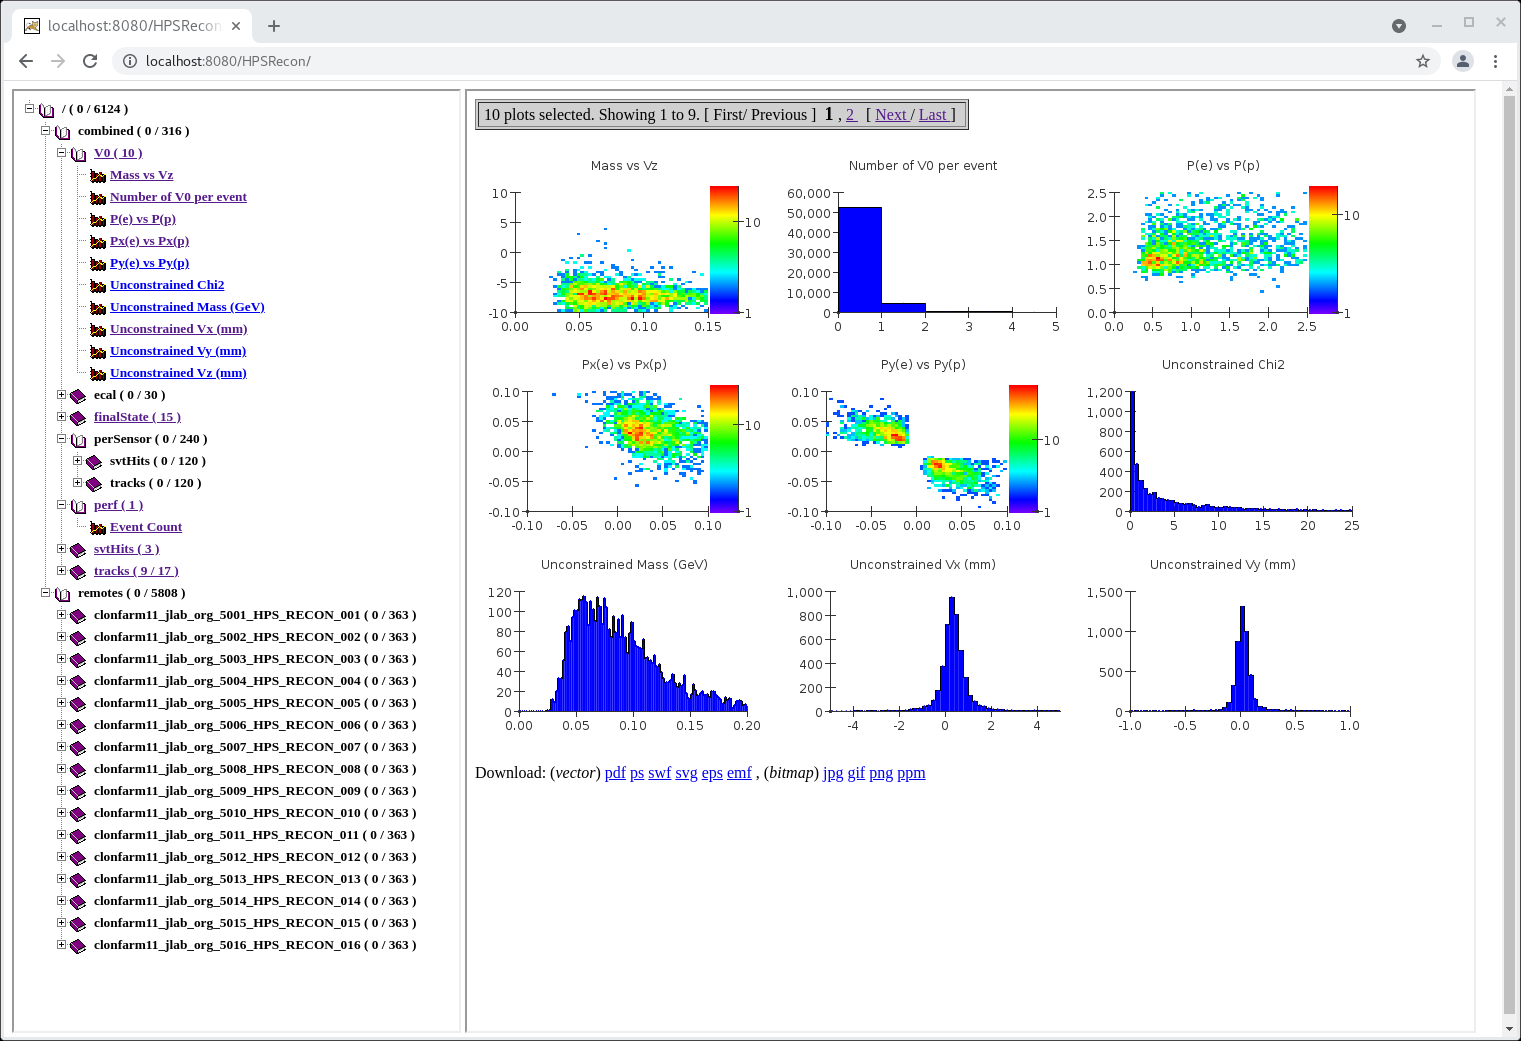
Above is a snapshot of the web display of the online monitor (as of Aug 26, subject to change). On the left side, it shows histograms arrayed in a directory structure.
- Clicking on a directory opens that directory and shows, right window, all histograms in that directory
- if there are more than 9 histograms, there are links to go to other pages in the right hand window
- each individual plot is clickable either in the left or right windows and will give a larger view of that single plot
This page should auto-refresh every 5 seconds. Sometimes it does not so you will have to refresh yourself.
There are two top-level directories: combined and remote.
- The combined directory shows plots where the plots from individual recon stations have been summed.
- Use these for most monitoring.
- The remote directory shows the plots for just events processed in that station (in this case we were running 16 stations)
- For SVT or ECal occupancy monitoring you can pick one of these and browse to the appropriate directory (e.g. perSensor/svtHits/svtOccupancy)
ECal Monitoring Plots
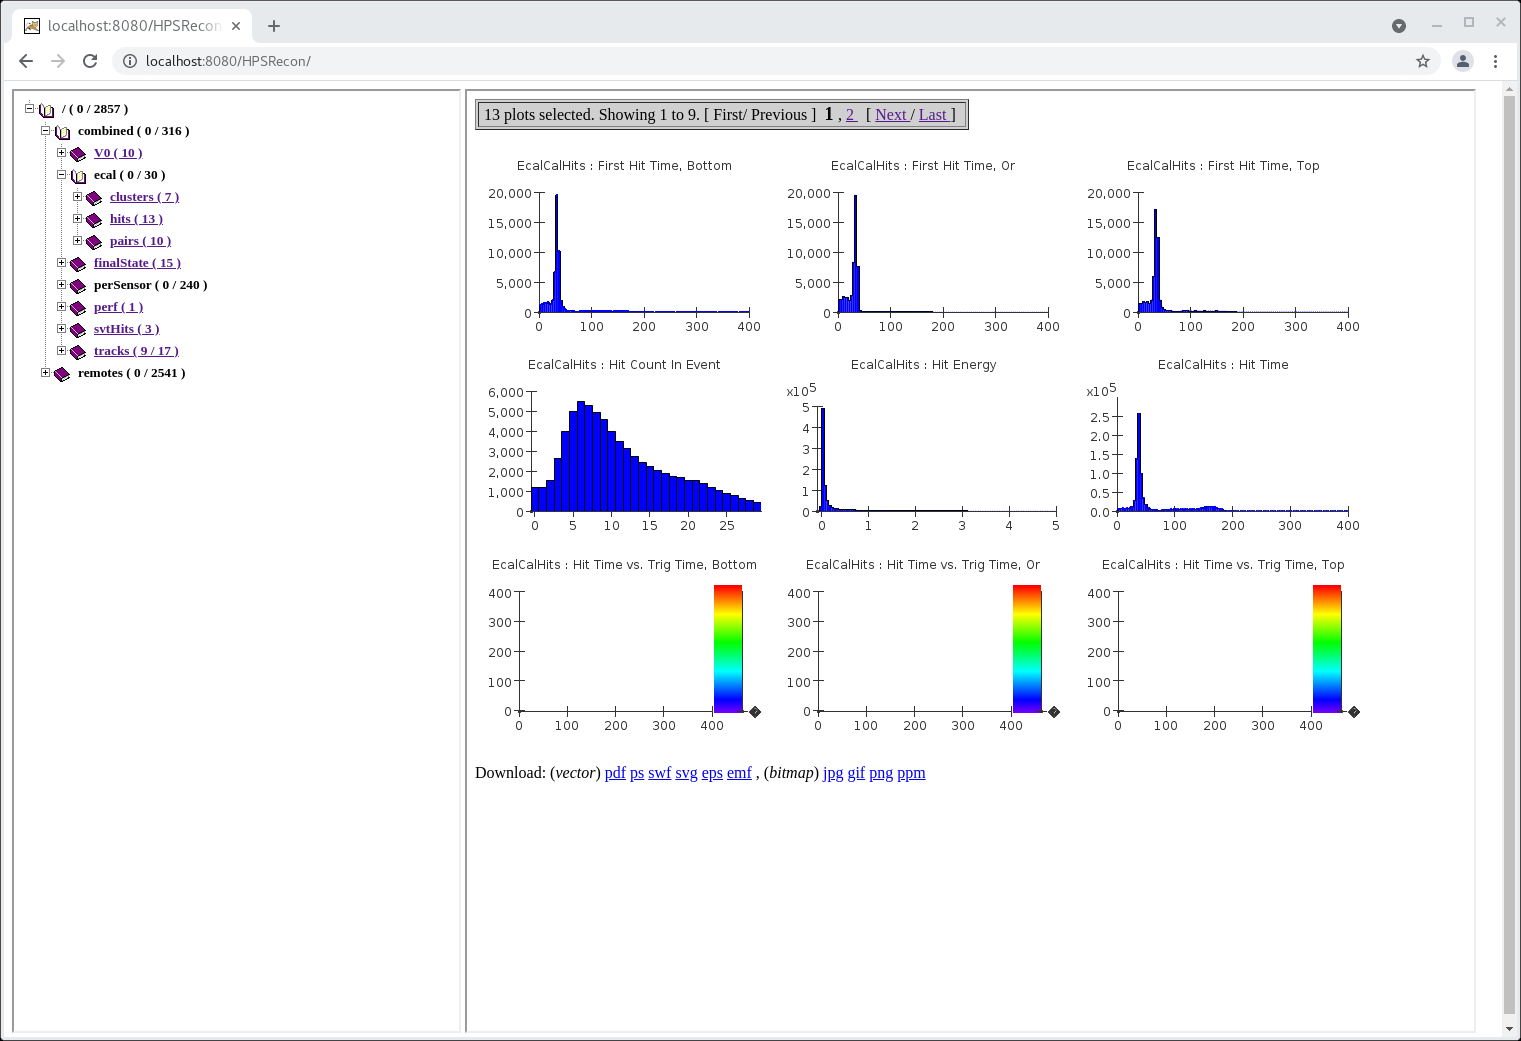
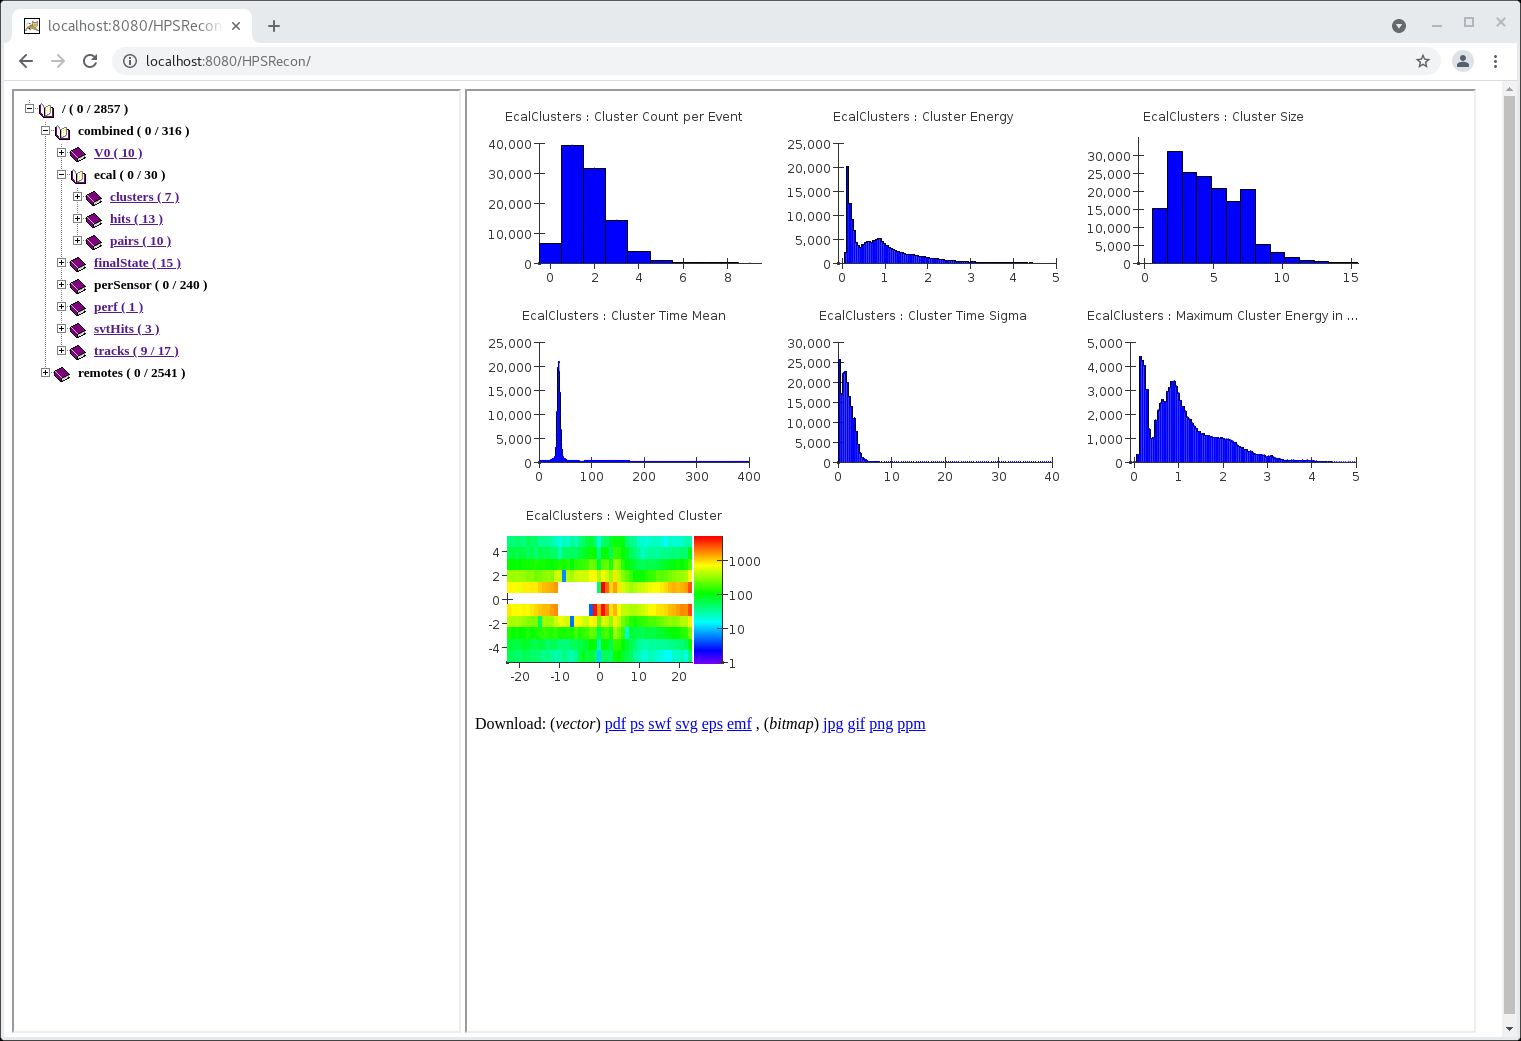
Some blurp about what to look for in ecal hits/clusters plots