Weekly progress of the Integrated Data Processing Environment (IDPE) for Time Correlation Experiments (TCE)
2012-11-05 – 2012-11-11 Week progress
A src/PsanaConfigFileGenerator.py
A src/FileNameManager.py
A src/BatchJobPedestals.py
A src/AppDataPath.py
A src/ConfigFileGenerator.py
A src/GUIDark.py
A src/ImgSpeButtons.py
A src/ImgSpeNavToolBar.py
A src/ImgSpeWidget.py
A src/ImgSpeWithGUI.py
A data/scripts/psana-pedestals.cfg
A data/scripts/psana-tahometer.cfg
2012-11-12 – 2012-11-18 Week progress
A src/GUIFileBrowser.py - file browser for text files of this project.
A src/GUIHelp.py - pop-up box with message as a widget.
A src/GUIWorkResDirs.py - separate widget for setting of work and result output directory and common prefix file name.
In src/GUILogger.py and src/Logger.py - now messages are accumulated in 2d tuple. Add filtration by the message type "debug", "info", "warning", etc.
src/GUIFiles.py is significantly re-organized; now it is GUI with tabs.
All significant fields are moved in GUIs like src/GUIDark.py (GUIData, GUIFlat).
src/GUIDark.py - is re-organized.
In the interactive plot:
- In src/ImgSpeWithGUI.py the src/ImgSpeNavToolBar.py - is depricated
- src/ImgSpeButtons.py - re-organized: add save, reset, and menu buttons, log check-box.
- In src/ImgSpeWidget.py - the log functionality needs to be implemented...
2012-11-19 – 2012-11-25 Week progress
Suggestions from Marcin:
- Time(sec) - should be the averaged time between frame time-stamps.
- Spectral plot: log-scale for X-axis only.
- Flat field and Blamish files will be provided from external apps. No need to evaluate them now. Needs to be selected by the path.
- Substitute the start and end events after the scan.
Progress:
- Restracturization:
tahometerreplaced bypeds_scan. - update the start and end fields after scan.
- remove psana log files before job submission in batch.
- the start and end fields are set from cofig.pars, if the scan log-file is availabe, they are updated from this file.
- reset fields to default if the input xtc file is changed.
- A src/GUIFlatField.py - file selection, plot, browse file
- A src/GUIBlamish.py
- A src/GUIMainTB.py - try different view for composite window
- A src/GUIMainSplit.py - try different view for composite window
- Add psana module: ImgAlgos::ImgTimeStampList - creates the time-stamp list and evaluates the mean time between frames and its RMS.
- in GUIDark.py use variables produced by the ImgAlgos::ImgTimeStampList.
2012-11-26 – 2012-12-02 Week progress
Suggestions from Marcin:
- Marcin prefers layout with separated GUILogger window, like in GUIMainTB.py
- Need in a tool reporting problems in time-stamp sequence.
- In GUIDark.py - untill the total number of events is unknown, use end "-1" and generate a warning if it is submitted in batch for pedestals.
- Add check-box showing if the Blamish and Flat-field files will be applied
- Marcin returned the paper-copy of GUIs with comments about titles and parameters.
- The list of variables for intensity monitor:
- IPM2 [CH0,...,CH3]
- IPMMON0 [...]
- IPM4 [...]
- IPM5 [...]
- GASDET [...]
- Needs in separate GUI for intensity monitors for normalization and veto.
Progress:
- In GUIBlamish.py and src/GUIFlatField.py add check-boxes.
- Apply Marcin's comments to GUIs with System, Setup etc. parameters, GUICCDCorrectionSettings.py is removed..
- In src/GUIMainTB.py optimized the GUI sizes.
- Changed names from GUIBatch... to GUISystem...
New psana module Psana Module Catalog - Old#Module ImgAlgos::IntensityMonitorsData, which gets data for equivalent HDF5 variables:
/Configure:0000/Run:0000/CalibCycle:0000/Bld::BldDataFEEGasDetEnergy/FEEGasDetEnergy
/Configure:0000/Run:0000/CalibCycle:0000/Bld::BldDataIpimbV1/XCS-IPM-02
/Configure:0000/Run:0000/CalibCycle:0000/Bld::BldDataIpimbV1/XCS-IPM-mono
/Configure:0000/Run:0000/CalibCycle:0000/Ipimb::DataV2/XcsBeamline.1:Ipimb.4
/Configure:0000/Run:0000/CalibCycle:0000/Ipimb::DataV2/XcsBeamline.1:Ipimb.5
in psana they can be accessed as:
  m_srcFEEGasDetE = configStr("feeSource", "BldInfo(FEEGasDetEnergy)");
  m_srcIPM2       = configStr("ipm2",      "BldInfo(XCS-IPM-02)");
  m_srcIPMMono    = configStr("ipmmono",   "BldInfo(XCS-IPM-mono)");
  m_srcIPM4       = configStr("ipm4",      "DetInfo(XcsBeamline.1:Ipimb.4)");
  m_srcIPM5       = configStr("ipm5",      "DetInfo(XcsBeamline.1:Ipimb.5)");
and share pointers:
  shared_ptr<Psana::Bld::BldDataFEEGasDetEnergy> fee = evt.get(m_srcFEEGasDetE);
  shared_ptr<Psana::Ipimb::DataV2> data2 = evt.get(m_src); // for m_srcIPM4 and m_srcIPM5
  shared_ptr<Psana::Bld::BldDataIpimbV1> ipimb1 = evt.get(m_src_ipimb); // for m_srcIPM2 and m_srcIPMMono
- In GUISystemPars: add total number of events and dt+-rms to GUISystemPars.
- In GUIDark: add check-box and file-browser button with complete functionality.
- In GUIDark: add protection for pedestal job submission in batch with default number of events.
- In BatchJobPedestals: add protection against duplicated job submission in batch using timeout (now 100 sec) or until the previous job is DONE.
- In ImgSpeWidget: implemented the log-scale plot with full functionality and protections...
2012-12-03 – 2012-12-09 Week progress
No meeting this week due to experiments in xcs hatch.
Progress:
- In GUIFileBrowser: add one more parameters after the list of files, the file to start browser
- GUIData is implemented with full functionality including
- check box to activate/protect buttons
- "File" button and info field - selects the xtc file
- "Scan" button - submits scanner job in batch which
- counts events,
- saves in file the time records ind evaluate an average interval between frames
- saves in file the intensity monitor data
- "Average" button - submits job in batch for averaging image for the specified range of events
- "Check status" button - checks the status of both batch jobs, check if the file with averaged image is available, update the info fields for number of events and averaged time between frames
- "Check files" button - prints the list of work files for data and check their availability
- "Browse" button - open the file browser with a list of work files for data
- "img-Plot" button - plots the averaged image from file
- "t-Plot" button - shows the plot for time records saved in file
- "Remove" button - removes all work files from the work directory
- GUIIntensityMonitors: GUI for Intensity monitors
- PlotArray.py, PlotArrayButtons.py, PlotArrayWidget.py - plot for array presentation
- PlotTime.py, PlotTimeWidget.py - plot for time records presentation
2012-12-10 – 2012-12-16 Week progress
Q&A Marcin:
- Q: XcsBeamline.2 - is it used simultaneously with XcsBeamline.1 ?
- A: XcsBeamline.1
- Q: What control parameters should be added for intensity monitors?
- A: should be added:
- radio button for normalization or no-normalization
- filter data check box
- low-upper amplitude range
- A: should be added:
- Q: Layout of GUIMainTB.py with variable height, is it ok?
- A: Looks fine.
- Q: Layout variation for check-box - disappearance of buttons, is it ok?
- A: Change color of button-titles.
- Q: What image buttons are used as a mask editor etc.
- A: GUIAnalysisSettings:
- "MaskPolygon" button - for polygon editor on data image
- "Show Mask & Partitions" button - shows the mask and partitions on data image
- A: GUIAnalysisSettings:
Suggestions from Marcin:
 Add button to all plots and gui to submit them in ELog.
 Change log presentation for image histogram - log for vertical scale only.
Progress
- GUIDark and GUIData - inappropriate change of style for "end" field is fixed
- GUIDark, GUIData, GUIBlamish, GUIFlatField - have changed behavior for non-active buttons:
- for now it is set to default - frame of buttons disappeared for non-active
- GUIFlatField has an example of how to set a dynamic style-sheet for non-default behavior styles
- PlotImgSpeWidget.py - change log scale from x to y
- GUIIntensityMonitors.py - add more fields:
- radio buttons for normalization
- check boxes for selection
- edit fields for Imin and Imax values with changing behavior and style depending on radio and check box status. Check them for equity to default and Imin >= Imax
- Check move window coordinates for plots... Some of them opens in unexpected places.
- GUIELogPostingDialog, GUIELogPostingFields, PlotArrayButtons, PlotImgSpeButtons, and GlobalUtils: submission of message with attached plots in ELog
- Add icons to some of frequently used buttons.
- Add button for some of GUIs amd plots to submit them in ELog.
2012-12-17 – 2012-12-23 Week progress
Q&A Marcin:
- Discuss layout of fields in
- GUIIntensityMonitors - Is it necessary to use Imax/Imin for normalization?
- GUIELogPostingDialog, GUIELogPostingFields - is it consistent with what you want?
- Layout of buttons
- GUIMainTB - it is possible to change the "buttons with icons and text" -> "buttons with icons" -> "icons". Which style is preferred?
- GUIDark.py, GUIData.py, etc. - style for active/non-active buttons - just default or add more colors, like in GUIFlatField ?
Progress
- GUIDark and GUIData - add check box for parameters cp.use_dark_xtc_all and cp.use_data_xtc_all with appropriate behavior for check box but_path and edi_path fields. Now, the name of the file for batch job is taken from fnm.path_dark_xtc_cond() and fnm.path_data_xtc_cond(), respectively.
- FileNameManager - fixed a few typos in the file name methods: "dark"->"data"
2012-12-24 – 2013-01-06 Week progress (winter break)
Progress
- GUIRun, GUIRunInfo, GUIRunSplit - new style GUI for the splitting procedure.
2013-01-07 – 2013-01-13 Week progress
Progress
- GUIRunProc, BatchJobCorAna, GlobalUtils
2013-01-14 – 2013-01-20 Week progress
Q&A Marcin:
![]() Add lock for ELog submission dialog box
Add lock for ELog submission dialog box
![]() Add lock for nparts field in GUIRunInput
Add lock for nparts field in GUIRunInput
![]() GUIIntensityMonitors:
GUIIntensityMonitors:
- change response on radio button
- short intensity monitor names
Progress
- GUIRunInfo change name to GUIRunInput
- GUIRunProc - is completed
- GUIRunMerge
- GUIRunAuto
- GUIELogPostingDialog, GUIELogPostingFields - add lock, restructorization for editable fields.
- GUIIntensityMonitors - (1) remove the selection fields style change for radio button, (2) use a list of short intensity monitor names.
2013-01-21 – 2013-02-03 Week progress
Q&A Marcin:
![]() Reorganize GUISetupInfoLeft.py for CCD position input in modes: Beam Zero, Specular, and Data
Reorganize GUISetupInfoLeft.py for CCD position input in modes: Beam Zero, Specular, and Data
Progress
![]() Fixed image partitioning, processing, and merging in ImgAlgos/src/ImgVsTimeSplitInFiles.cpp, CorAnaData.cpp, and CorAnaMergeFiles.cpp
Fixed image partitioning, processing, and merging in ImgAlgos/src/ImgVsTimeSplitInFiles.cpp, CorAnaData.cpp, and CorAnaMergeFiles.cpp
![]() Add CCD orientation in GUICCDSettings
Add CCD orientation in GUICCDSettings
- CCD is always displayed as a matrix of (row,col) with origin in the top left corner.
- CCD orientation is assumed as entire world is rotated w.r.t. CCD
Work on
- GUIViewControl.py
- GUIViewResults.py
- ViewResults.py
- g2 Normalization - need to use parameters from GUISetupInfo etc.
Map evaluation speed in ViewResults.py for 1300x1340 img - x,y maps = 0.02sec
- r map = 0.05sec
- theta map = 0.12sec
- q map = 0.4sec
2013-02-04 – 2013-02-10 Week progress
Progress
Work in progress on
- GUIViewControl.py
- ViewResults.py
- PlotG2*.py
![]() Currently available plots for:
Currently available plots for:
- Raw data maps (tau): <Ip>, <If>, <Ip*If>, g2-raw
- Geometry maps: X, Y, R, Phi, Q for direct beam mode
- Partitioning maps: Phi, Q, Q-Phi maps for
staticanddynamicpartitions - Masks: Image limits, blemish, hot pixels, good regions, total
- Calculated maps (tau): total mask as applied at normalization and for maps
- normalization factors 1/<Ip>, 1/<If> for static bins,
- g2 as a map
- g2 averaged over dynamic bins
- g2 for dynamic bins vs tau as a 2D histogram
- g2(tau) plot for dynamic bins as a set of graphic
Q to Marcin:
- How to calculate angle and Q in reflective geometry?
- Presentation of CCD image and detector orientation issues.
2013-02-11 – 2013-02-17 Week progress
Progress
Work on mask editor application:
- All Drag*.py
- MaskEditor.py, MaskEditorButtons.py
2013-02-18 – 2013-02-24 Week progress
Progress
![]() Mask Editor is completed at 1st approximation. Can be executed as an embedded and standalone application.
Mask Editor is completed at 1st approximation. Can be executed as an embedded and standalone application.
- DragPolyline.py is added
- Status "button" is added
- finger-pointer for sensitive objects is added
- I/O features are extended to: Load image, Load forms, Save forms, Clear forms, Print forms, Save mask, save Inv-M(ask).
- standalone application
medis added with a banch of optional parameters.
2013-02-25 – 2013-03-03 Week progress
Progress
![]() Frame orientation in lab x-y coordinates
Frame orientation in lab x-y coordinates
Use parameters: cp.y_is_flip.value() (True) and cp.ccd_orient.value()
- Image plot in PlotImgSpeWidget.on_draw(...): flip Y axis in image plot and add rotation
- Mask calculation for figures defined in lab x-y frame: MaskEditorButtons.get_mask_total()
- Pixel maps generation in ViewResults.ccd_pixel_coordinates(sp)
Q: Is it ok?
- Partition limits for q and phi? Use beam x0,y0 and mask total.
- Will use 0-th bin for everything outside the allowed binning area from q
- In Setup Info CCD Image Size: use rows cols, not x,y
- Hot pixel and saturated pixel masks are always on?
2013-03-04 – 2013-03-10 Week progress
Progress
- GUIViewControl.py - hide/show more result buttons
- ImgAlgos::ImgMaskEvaluation - evaluate hot and saturated pixel masks
- Integrate ImgMaskEvaluation module in configuration file
- ImgAlgos::ImgCalib, ConfigFileGenerator.py, ImgAlgos::ImgParametersV1
- subtraction of pedestals
- apply threshold in N*RMS or constant
2013-03-11 – 2013-03-17 Week progress
Q to Marcin:
map_image_refl()inq_functions.txtdoes not work for reasonable set of parameters...wavelength = (1.236)/energy- should be: 1.23984 ?- Need in PV variables for
- photon beam energy (from electron beam energy Bld.ebeamL3Energy()?)
- (x,y) detector position for direct beam, specular, and data
- detector orientation
- selection of geometry - transition or specular
- Comparison for
/reg/data/ana12/xcs/xcsi0112/xtc/e167-r0015-s00-c00.xtc– data,/reg/data/ana12/xcs/xcsi0112/xtc/e167-r0020-s00-c00.xtc– dark
Progress
- Reflected beam geometry is implemented in
ViewResults.pyinget_q_map_for_rb(sp),get_theta_map_for_rb(sp),get_reflected_beam_geometry_pars(sp)modules.
Currently the switch between the direct and reflected beam geometry is used from tab status variable:cp.exp_setup_geom.value()
If the PV variable will be used, then the switch should be changed in ViewResults.get_q_map(sp)module.
Add evaluation of the hot pixel mask in ImgAlgos::ImgAverage
Now the hot pixel mask is evaluated in the dark run averaging, using threshold on RMS. The threshold value and on/off check-box are implemented in the GUICCDSettings.py
2013-MM-DD Results on g2 form Marcin
Q to Marcin
- Presuming that for each value of tau we have averaged over time (events) per-pixel values of Ii, If, and
I2=<Ii*If>. In calculation of normalization factors<Ii>and<If>for q-static bins:- Do you count in average pixels where Ii=0, If=0?
For example,<Ii> = Sum_over_pixels Ii / number_of_pixels,
what stands here fornumber_of_pixels;
(1) all pixels in static bin, or
(2) all pixels in static bin where Ii>0 ? - Do you apply any lower/upper threshold on Ii and If?
- Do you count in average pixels where Ii=0, If=0?
- Then we have per-pixel value of
R = I2/(<Ii> * <If>).
In calculation ofg2 = <R>as an average over pixels of the dynamic bins:- Do you count in average pixels where R=0?
- Do you apply any lower/upper threshold on R=0?
2013-03-18 – 2013-03-24 Week progress
Progress
![]() Develop psana module
Develop psana module ImgAlgos::ImgIntMonCorr to normalize image on intensity monotor data.
![]() Include
Include ImgAlgos::ImgIntMonCorr in data-flow processing in CorAna/data/scripts/psana-cora-split.cfg and ConfigFileGenerator.py etc.
![]() Review of psana algorithms for data processing chain. Change data types for processing and inter-module exchange stages. Everything looks fine!
Review of psana algorithms for data processing chain. Change data types for processing and inter-module exchange stages. Everything looks fine!
![]() Submission of messages with attachments to ELog using response ID and Igor's new interface: Python module for posting message into ELog
Submission of messages with attachments to ELog using response ID and Igor's new interface: Python module for posting message into ELog
![]() Add protection against Split/Process/Merge job submission if Auto-processing is already active.
Add protection against Split/Process/Merge job submission if Auto-processing is already active.
2013-03-25 – 2013-03-31 Week progress
Q&A with Marcin on 2013-03-28:
Comparison of data processing and results
- How do you process
/reg/data/ana12/xcs/xcsi0112/xtc/e167-r0015-s00-c00.xtc– data,
/reg/data/ana12/xcs/xcsi0112/xtc/e167-r0020-s00-c00.xtc– dark- Hot pixel mask threshold : 10 ADU
- Saturated pixel mask threshold : 65000 ADU
- LLD threshold : const 20-30 ADU
- ROI mask
- Blemish mask
- List of tau : add to Analysis Settings
- sample-to-detector distance : 7.5m
- Partitioning
- phi: 1
- q: 100-static, 18-dynamic
Danial works on these variables:
- E-gamma variable
- Geometry variable
- Beam center
Q map for reflected beam geometry
- chart with angles
- evaluation of cos for non-right triangle
- qx and qy projections. Why does qz is not accounted like in transmission geometry?
Progress
- minor improvements and extra protections in many places
- do not rotate g2_vs_tau plot
- add src/GUIFilesStatusTable.py
- add files' status tables GUIFilesStatusTable.py in GUIData and GUIDark
- add GUIListOfTau.py to select/create the file with tau indexes
- in GUIFileBrowser.py add edit and save options
- in PlotImgSpe.py and PlotImgSpeButtons.py add option to select and load image from txt file
- Fix binning at the boarder; in ViewResults.valueToIndexMasked(V, VRange, mask=None) : add protection for V==Vmax
2013-04-01 – 2013-04-07 Week progress
Q to Marcin
In order to proceed with this project I need in your feedback;
comparison of processing results for runs
   /reg/data/ana12/xcs/xcsi0112/xtc/e167-r0015-s00-c00.xtc  data,
   /reg/data/ana12/xcs/xcsi0112/xtc/e167-r0020-s00-c00.xtc  dark
- EPICS variables for automatic initialization
- We need to discuss what results and how should be presented/saved.
Q map for reflection geometry
- for transmission geometry q= 4*pi/wavelength * ...
for reflection geometry q= 2*pi/wavelength * ... Is it correct ?
- wavelength = 1.23984/sp.photon_energy # 1.23984 ? nm
in stead of 1.236
Progress
- Add print button/method for <g2>(tau,<q>) table of results
- q map for reflected beam - use the last portion of Marcin's code
Reflective geometry
q map for comparison:
is obtained for parameters:
- Pixel size = 0.02 mm
- CCD position: (x,y) = (0,0) in all cases
- Beam zero: (x,y) = (722,632) pix
- Specular: (x,y) = (732,732) pix
- sample-to-detector distance = 15 mm
- Egamma = 7.654 keV
2013-04-08 – 2013-04-14 Week progress
Mtg with Marcin:
- Have to get the same results for g2(tau) function
- Need more plots for results
- g2(tau) for q-dynamic
- Average intensity and Intensity(q-static)
- Intensity(q-static, t)
- Histogram for intensity monitor
Fit results for function g2(tau|pars) = C*exp[-(2t/tau0)**beta] + B
- plot for all fits with beta=1 and float,
- tau0 vs q-dynamic
- C vs q-dynamic
- B vs q-dynamic
- beta vs q-dynamic
Progress
- implemented new psana module:
ImgAlgos.ImgIntForBins, which- takes the (image size) map of bin numbers from file
fname_map_bins, - evaluates average intensity for each bin,
- saves results in the file
fname_int_binsfor the lowernumber_of_bins.
- takes the (image size) map of bin numbers from file
- implemented new classes
PlotGraph.py,PlotGraphWidget.pyfor plots- Intensity(q-static)
- Intensity(q-static, t)
2013-04-15 – 2013-04-21 Week progress
Work on LogBookGrabber project.
2013-04-22 – 2013-04-28 Week progress
- Add protection with poping-up warning message box if the file for Intensity(q-static,t) is not available.
- Search for a reason of the difference in results
2013-04-29 – 2013-05-05 Week progress
- Marcin is busy on shifts
2013-04-06 – 2013-05-12 Week progress
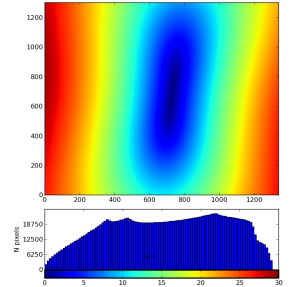
Image and spertrum of the difference between my <Ip>(tau=20) and Marcin's IP_comp.np.npy
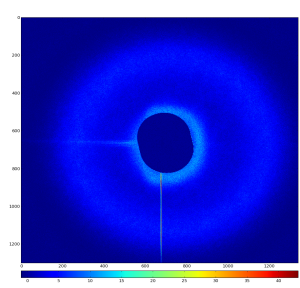
- I do not apply any vertical-strip mask
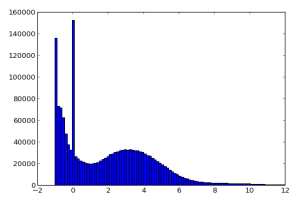
- Spectrum of difference:
- peak at 0 (images are equal) is due to 0 amplitude bins in center and edges
- peal at -1
- peak at 3
Marcin's and my spectrum of <Ip>(tau=20) at small amplitudes
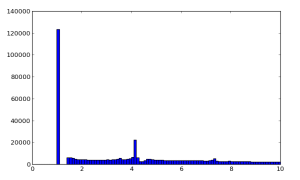
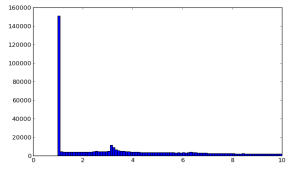
- Beside the protection
notzero=1Marcin's spectrum has a threshold 1.4 - Spectra have presumably the same structure in different amplitude at 3.xx and 4.xx
Marcin's and my spectrum of <Ip>(tau=20)
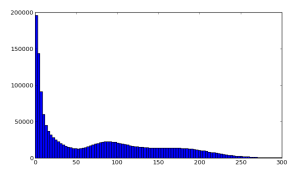
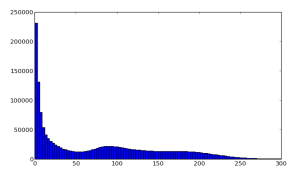
- Large scale spectral shape is about the same
New document: Algorithms for Time Correlation Experiments
2013-05-27 – 2013-06-22 Week progress
New results from Marcin
Directory with scripts:
/reg/neh/home1/sikorski/scripts/
                                run_correlator.py
/reg/neh/home1/sikorski/scripts/correlator/
                                           xcs_correlator.py
- Pyana module for data pre-processing:
/reg/neh/home1/sikorski/xcs_pyana_current/xcs_timepix_pkg/src/import_data.py
- Pyana configuration file:
/reg/neh/home1/sikorski/xcs_pyana_current/pyana.cfg
Reduced data files:
/reg/neh/home1/sikorski/xcs_pyana_current/e167-r0015-s00-c00/2013-04-03-10-39-22-734268/*.npy
Marcin's code description
Qs about code of import_data.py
Assume that import_data.py is intended to get data from xtc file, split image for 10x10 parts, and save them for ALL events in files like /reg/neh/home1/sikorski/xcs_pyana_current/e167-r0015-s00-c00/2013-04-03-10-39-22-734268/e167-r0015-s00-c00_data_520_268.npy
Open one file per (130,134) image segment and other files:
    def beginjob( self, evt, env ) :
        ...
        for i in range(0,self.frame_size[0],self.step_x):
            for j in range(0,self.frame_size[1],self.step_y):
                fina = path + '/' +fina_gen + '_data_' + str(i) + '_' +str(j) + '.npy'
                self.f_id.append(open(fina, 'w'))

        fina = path + '/' +fina_gen + '_avg_img' + '.txt'
        self.f_id_avg =  open(fina, 'w')
        ...
Get image from data, and saves its parrts in the SAME !!! file...
The last event is actually saved.
    def event( self, evt, env ) :
        ...
            if self.detector == 1:
                 PI = evt.get(xtc.TypeId.Type.Id_PrincetonFrame)
                 frame = np.array(PI.data()[self.R1:self.R2,self.C1:self.C2], dtype = np.float64)
                 a = np.where(frame >= self.saturation)
                 self.saturated_pixels[a] = 0
                 np.subtract(frame, self.dark, frame)
                 frame[frame < self.LLD] = self.not_zero
        ...

# NOT QUITE CLEAR, WHAT ARE YOU DOING HERE????
# In this job self.bin[0]=1 and self.bin[1]=1
        if self.flag_bin == 1:
                np.multiply(self.frame_binned, self.zeros, self.frame_binned)
                for b1 in range(self.bin[0]):
                        for b2 in range(self.bin[1]):
                                np.add(self.frame_binned, frame[b1::self.bin[0], b2::self.bin[1]],self.frame_binned)
                frame = self.frame_binned

        np.add(self.avg_img, frame , self.avg_img)
        counter = 0
        for i in range(0,self.frame_size[0],self.step_x):
            for j in range(0,self.frame_size[1],self.step_y):
               np.save(self.f_id[counter], frame[i:i+self.step_x,j:j+self.step_y])
               counter += 1
        ...
frameis LOCAL variable inifandforscopes...
Check for results of data pre-processing
pedestal files coincides:
/reg/neh/home1/sikorski/xcs_pyana_current/e167-r0020-s00-c00/2013-04-03-09-43-06-939033/e167-r0020-s00-c00_dark_img.txt
and mine: work/t1-xcsi0112-r0020-peds-ave.txt
averaged images coincides if pedestal is not subtracted in pyana
In import_data_test.py, if pedestals are not subtracted:
PYANA/e167-r0015-s00-c00/e167-r0015-s00-c00_avg_img_raw.txt
and mine: work/t1-xcsi0112-r0015-data-ave.txt
averaged images coincides if LLD=20 is not applied in pyana !
Marcin subtracts pedestals from raw image and apply LLD:
/reg/neh/home1/sikorski/xcs_pyana_current/e167-r0015-s00-c00/2013-04-03-10-39-22-734268/e167-r0015-s00-c00_avg_img.txt
In import_data_test.py, if I do the same but do not apply LLD:
../PYANA/e167-r0015-s00-c00/e167-r0015-s00-c00_avg_img_wo_lld.txt'
coincides with
difference between:
work/t1-xcsi0112-r0015-data-ave.txt
work/t1-xcsi0112-r0020-peds-ave.txt
Qs about code of xcs_correlator.py
/reg/neh/home1/sikorski/scripts/correlator/xcs_correlator.py
class img_correlator:
    def __init__ (self,path):
        # path to the data reduced using pyana "import_data.py" code
        self.path = path
        self.LLD = 200 !!!!!!!!!!!
        self.notzero = 1

    def set_LLD(self, LLD): <--- IS NOT CALLED
        self.LLD = LLD
  def correlator_2D(self, fina):
           data[:,:,i][data[:,:,i]<(self.LLD)] = self.notzero
2013-08-27 New results from Marcin
After fixing LLD and normalization for one static bin Marcin plot the difference between our results for g2:
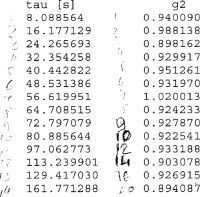
Marcin's results on g2 from file: /reg/neh/home1/sikorski/xcs_pyana_current/e167-r0015-s00-c00/2013-08-27-14-28-40-303177/results_2013-08-27-15-07-34-961055/g2
tau [s]             g2             g2
8.088564        0.021423        3.380312
16.177129       0.021402        3.645404
24.265693       0.020048        3.287331
32.354258       0.019998        3.425617
40.442822       0.020130        3.482928
48.531386       0.019919        3.460162
56.619951       0.022181        3.771666
64.708515       0.019538        3.435755
72.797079       0.019489        3.398190
80.885644       0.020371        3.387679
97.062773       0.019899        3.473071
113.239901      0.020628        3.352052
129.417030      0.019564        3.417886
161.771288      0.018648        3.352710
2013-08-30 results for run 11 (dark 20) of xcsi0112
<g2> for dynamic bins vs tau
==============================
 tau     tau[s] \ <q> | 0.052
-----------------------------
   1         8.088406 | 3.558
   2        16.176812 | 3.151
   3        24.265218 | 3.447
   4        32.353624 | 3.356
   5        40.442030 | 3.311
   6        48.530436 | 3.413
   7        56.618842 | 3.155
   8        64.707248 | 3.355
   9        72.795654 | 3.291
  10        80.884060 | 3.160
  12        97.060872 | 3.252
  14       113.237684 | 3.275
  16       129.414496 | 3.320
  20       161.768120 | 3.473
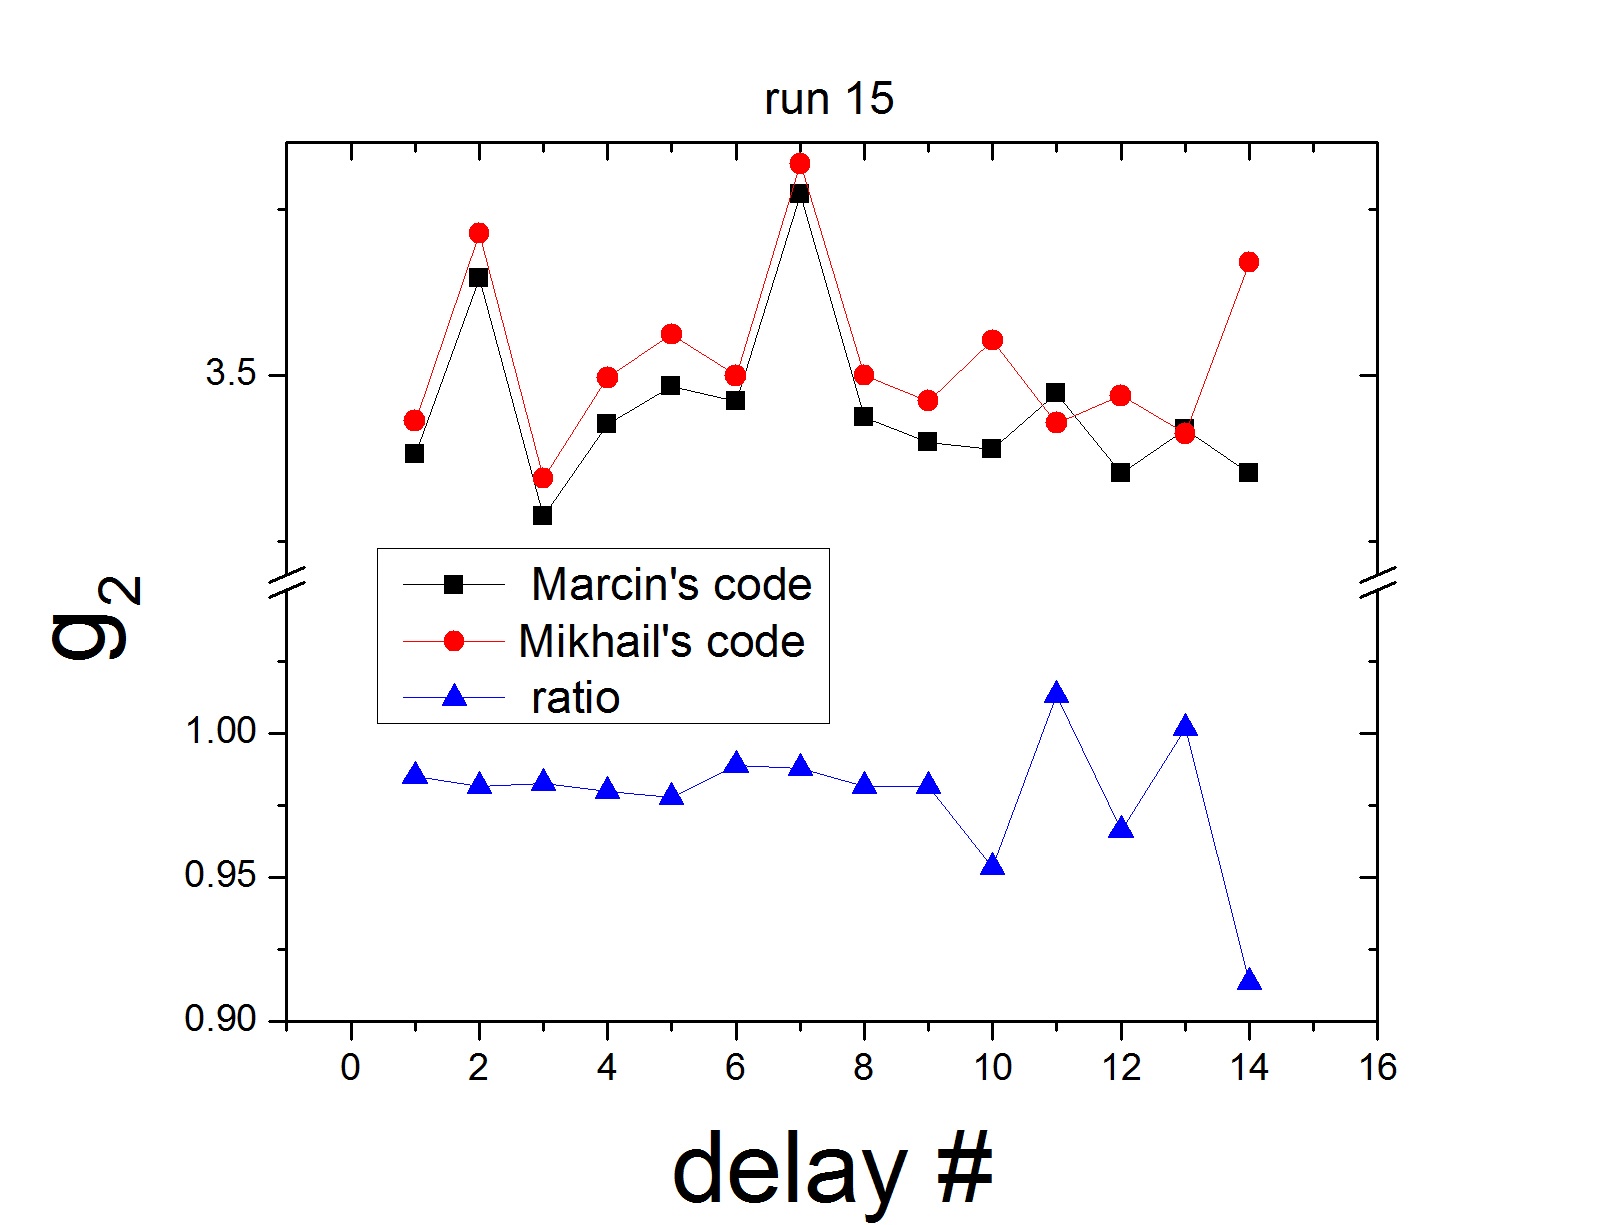
2013-10-08 Comparison of results for xcsi0112, run15 (dark20)
Conditions
- dark run: /reg/d/ana12/xcs/xcsi0112/xtc/e167-r0020-s00-c00.xtc use all 75 events
- data run: /reg/d/ana12/xcs/xcsi0112/xtc/e167-r0015-s00-c00.xtc use all 500 events
- do not use any intensity monitor selection or correction
- do not use any mask including hot pixel, saturation, blemish, ROI, and restriction on the image size
- use LLD as a constant ADU threshold = 20
- use a single q-phi static bin
- use a single q-phi dynamic bin
- q value is not an issue for current comparison, so geometry does not matter
Dark image
Marcin's dark file:
/reg/neh/home1/sikorski/xcs_pyana_current/e167-r0020-s00-c00/2013-04-03-09-43-06-939033/e167-r0020-s00-c00_dark_img.txt:
# Job name: e167-r0020-s00-c00
# Array shape: 1300 x 1340
278.826667      298.640000      304.880000      298.200000      300.106667      298.453333 ...
Has precision of 6 digits after decimal dot.
My dark file, evaluated in Pedestals averaging
278.827 298.64 304.88 298.2 300.107 298.453 ...
is adjusted to the same precision:
/reg/neh/home1/dubrovin/LCLS/PSANA-V01/work/t1-xcsi0112-r0020-peds-ave.txt
278.826667 298.64 304.88 298.2 300.106667 298.453333 ...
Exactly coincides after adjustment.
Mask of satturated pixels
Marcin's mask, evaluated in import_data,
/reg/neh/home1/sikorski/xcs_pyana_current/xcs_timepix_pkg/src/import_data.py:
/reg/neh/home1/sikorski/xcs_pyana_current/e167-r0015-s00-c00/2013-08-27-14-28-40-303177/e167-r0015-s00-c00_avg_img.txt
My mask, evaluated in Data averaging: /reg/neh/home1/dubrovin/LCLS/PSANA-V01/work/t1-xcsi0112-r0015-satpix-mask-level-65000ADU.txt
For run 15 both masks are ones for entire image.
Averaged data image before splitting
Marcin's averaged data image, evaluated in import_data, /reg/neh/home1/sikorski/xcs_pyana_current/xcs_timepix_pkg/src/import_data.py:
/reg/neh/home1/sikorski/xcs_pyana_current/e167-r0015-s00-c00/2013-08-27-14-28-40-303177/e167-r0015-s00-c00_avg_img.txt
0.000000 0.000000 0.000000 0.000000 0.000000 0.000000 0.000000 0.000000 0.000000 0.000000 0.000000 0.000000 0.000000 2.098667 0.561573 0.000000 0.000000 0.000000 0.000000 3.539360 2.335520
My averaged data image, evaluated in Splitting:
/reg/neh/home1/dubrovin/LCLS/PSANA-V01/work/t1-xcsi0112-r0015-data-ave.txt
- DO NOT COINCIDE YET!
- This file is obtained at data averaging, where pedestals are not subtracted.
- For direct comparison averaging need to be done at splitting stage.
2013-12-02 my new results for run 15 (dark 20) of xcsi0112
Direct evaluation of averaged image with subtracted pedestals is done in the psana script for image splitting.
1e-09 1e-09 1e-09 1e-09 1e-09 1e-09 1e-09 1e-09 1e-09 1e-09 1e-09 1e-09 1e-09 2.09866669 0.561573365 1e-09 1e-09 1e-09 1e-09 3.53936005 2.33552002
- now precision exceeds 6 digits after decimal dot,
zeros are already substituted by the minimal value 1e-9.
Results for g2
<g2> for dynamic bins vs tau
==============================
 tau     tau[s] \ <q> | 0.052
-----------------------------
   1         8.088413 | 3.380
   2        16.176826 | 3.645
   3        24.265239 | 3.287
   4        32.353652 | 3.426
   5        40.442065 | 3.483
   6        48.530478 | 3.460
   7        56.618891 | 3.772
   8        64.707304 | 3.436
   9        72.795717 | 3.398
  10        80.884130 | 3.388
  12        97.060956 | 3.473
  14       113.237782 | 3.352
  16       129.414608 | 3.418
  20       161.768260 | 3.353
- My new results on g2 coincides with 2-nd column of Marcin's calculation
in /reg/neh/home1/sikorski/xcs_pyana_current/e167-r0015-s00-c00/2013-08-27-14-28-40-303177/results_2013-08-27-15-07-34-961055/g2
2013-12-06 Mtg with Marcin
- Demonstration of how
tcmtworks from scratches - Marcin need to switch between imaging devices (cspad, pnccd, princeton, opal, epix, etc.)
How to run it for current version
sit_setup ana-0.10.6
tcmt
2014-01-20 Runs with CSPAD data
Run 196(dark) and run 185(data) from xcs84213.
Marcin
References
- Data Processing for Time Correlation - project description and status
- Algorithms for Time Correlation Experiments - algorithms used in this project
- Note on XCS code from Marcin - notes about Marcin's code and algorithms
Overview
Content Tools