Abstract
We discuss PSHist - the histogramming package for PSANA project.
Objectives
In PSANA framework we need in package which allows to accumulate data in form of histograms and tuples and save them in file for further analysis. Though it might be based on well-known underlying packages like ROOT, HBOOK, or HippoTuple, we prefer to use an uniform interface with abstract base class, substituting the direct interaction with underlying methods. This intermediate abstract layer provides a flexibility in implementation of new things, for example multithreding in analysis, which algorithm is not yet defined.
Structure and content of the package
Package PSHist contains the base abstract class and methods, which are implemented in derived class RootHist based on CERN's ROOT library. Inheritance between PSHist and RootHist classes and their dependence on Root classes are shown in table
PSHist       RootHist       ROOT
---------------------------------
HManager  <- RootManager    TFile
H1        <- RootH1         TH1
H2        <- RootH2         TH2
Profile   <- RootProfile    TProfile
Tuple     <- RootTuple      TTree
Column    <- RootColumn     TBranch
Headers
In order to use PSHist one need to include headers:
#include "PSHist/HManager.h"
#include "PSHist/Axis.h"
#include "PSHist/H1.h"
#include "PSHist/H2.h"
#include "PSHist/Profile.h"
#include "PSHist/Tuple.h"
#include "PSHist/Column.h"
ROOT headers which are needed for test purpose only:
#include "RootHist/RootHManager.h" // Is used for initialization
#include "root/TRandom.h"          // For random number generators
Interface
An example of the program interface for this histogram-tuple-management package can be presented as follows. First, the underlying (derived) package needs to be chosen and initialized. For example for ROOT
PSHist::HManager *hMan = new RootHist::RootHManager("pshist-test.root", "RECREATE"); // for ROOT
In PSANA framework user do not need in this initialization. It will be done automatically using the file name and mode from the list of configuration parameters.
Then later in the program we may create ntuple(s) without knowing what is the underlying histogram-tuple-storage management system,
PSHist::Tuple *pTuple = hMan->tuple( "TUPLE_N1", "My tuple title^{#alpha}" );
1d histograms
  PSHist::H1 *pH1_1 = hMan->hist1i( "H1_N0001", "My his1d 1 title^{#alpha}", 100, 0., 1.);
  PSHist::H1 *pH1_2 = hMan->hist1f( "H1_N0002", "My his1d 2 title^{#beta}",  axis4 );
  PSHist::H1 *pH1_4 = hMan->hist1d( "H1_N0004", "My his1d 4 title^{#delta}", 10, edges);
2d histograms
  PSHist::H2 *pH2_1 = hMan->hist2i( "H2_N0001", "My his2d 1 title^{#theta}", axis1, axis2 );
  PSHist::H2 *pH2_2 = hMan->hist2f( "H2_N0002", "My his2d 2 title^{#phi}",   axis1, axis3 );
and 1d profile histograms
  // Profile - 1d profile histograms
  PSHist::Profile *pP1_1 = hMan->prof1( "P1_N0001", "My profile 1 title^{#psi}",   60, 0, 1,  0, 1 );
  PSHist::Profile *pP1_2 = hMan->prof1( "P1_N0002", "My profile 2 title^{#iota}",  axis2,     0, 1 );
  PSHist::Profile *pP1_3 = hMan->prof1( "P1_N0003", "My profile 3 title^{#kappa}", 10, edges, 0, 1 );
where we use the class PSHist::Axis for declaration of equal or variable size bins:
  double edges[]={0, 0.05, 0.1, 0.2, 0.25, 0.3, 0.5, 0.55, 0.7, 0.9, 1};
  PSHist::Axis axis1(60,0,1);
  PSHist::Axis axis3(10,edges);
When the ntuple is created, its parameters (Columns) need to be defined once,
  double val;
  float freq;
  typedef struct {float x,y,z;} POINT;
  static POINT point;

  PSHist::Column *pColumn_1 = pTuple->column( &val,  "EBEAM/D" );
                              pTuple->column( &freq, "Freq/F"  );
                              pTuple->column( &point,"x:y:z"   );

      //TuplePar *pBeamEnergy  = nt->parameter("beamEnergy");
      //TuplePar *pBeamCurrent = nt->parameter("beamCurrent");
Then, in data processing stage for each event, we may accumulate data in created histograms and ntuple objects using pointers
            val     = gRandom->Gaus(2.5, 0.1);
            freq    = gRandom->Gaus(1.5, 0.1);
            point.x = gRandom->Gaus(1, 1);
            point.y = gRandom->Gaus(2, 1);
            point.z = gRandom->Gaus(3, 1);

            pTuple -> fill();
pointers
      //pBeamEnergy ->fill(E);
      //pBeamCurrent->fill(I);
or parameter names
      //nt         ->fill("beamEnergy", E);
      //nt         ->fill("beamCurrent", I);
      //nt         ->addRow();
Histograms and profiles can be accumulated using their pointers
            pH1_1 -> fill( gRandom->Rndm(1) ); // Uniform distribution on [0,1]
            pH2_1 -> fill( gRandom->Gaus(0.5, 0.1), gRandom->Rndm(1) );
            pP1_1 -> fill( gRandom->Gaus(0.5, 0.1), gRandom->Rndm(1) );

        //pointer -> fill(x,[weight]);
        //pointer -> fill(x,y,[weight]);
where we assume that all parameters like x, y, E, and I and optional weight were earlier defined.
When you are all done, write the data into a file:
  hMan -> write();
  delete hMan;  // close file
In PSANA framework the delete hMan; statement will be done automatically.
PSHist package classes and essential interface methods
Class HManager public methods
1-d histogram
  virtual H1 *hist1i(const std::string &name, const std::string &title, int nbins, double xlow, double xhigh) = 0;
  virtual H1 *hist1f(const std::string &name, const std::string &title, int nbins, double xlow, double xhigh) = 0;
  virtual H1 *hist1d(const std::string &name, const std::string &title, int nbins, double xlow, double xhigh) = 0;

  virtual H1 *hist1i(const std::string &name, const std::string &title, int nbins, double *xbinedges) = 0;
  virtual H1 *hist1f(const std::string &name, const std::string &title, int nbins, double *xbinedges) = 0;
  virtual H1 *hist1d(const std::string &name, const std::string &title, int nbins, double *xbinedges) = 0;

  virtual H1 *hist1i(const std::string &name, const std::string &title, PSHist::Axis &axis) = 0;
  virtual H1 *hist1f(const std::string &name, const std::string &title, PSHist::Axis &axis) = 0;
  virtual H1 *hist1d(const std::string &name, const std::string &title, PSHist::Axis &axis) = 0;
2-d histogram
  virtual H2 *hist2i(const std::string &name, const std::string &title, PSHist::Axis &xaxis, PSHist::Axis &yaxis ) = 0;
  virtual H2 *hist2f(const std::string &name, const std::string &title, PSHist::Axis &xaxis, PSHist::Axis &yaxis ) = 0;
  virtual H2 *hist2d(const std::string &name, const std::string &title, PSHist::Axis &xaxis, PSHist::Axis &yaxis ) = 0;
1-d profile histogram
  virtual Profile *prof1(const std::string &name, const std::string &title, int nbinsx, double xlow, double xhigh,
                                                  double ylow, double yhigh, const std::string &option="") = 0;
  virtual Profile *prof1(const std::string &name, const std::string &title, int nbins, double *xbinedges,
                                                  double ylow, double yhigh, const std::string &option="") = 0;
  virtual Profile *prof1(const std::string &name, const std::string &title, PSHist::Axis &axis,
                                                  double ylow, double yhigh, const std::string &option="") = 0;
Tuple
virtual Tuple *tuple(const std::string &name, const std::string &title) = 0;
Class Axis
  Axis (int nbins, double amin, double amax) : m_amin(amin), m_amax(amax), m_nbins(nbins), m_edges(0) {}
  Axis (int nbins, const double *edges) : m_amin(0), m_amax(0), m_nbins(nbins), m_edges(edges) {}
Class H1
virtual void fill(double x, double weight=1.0) = 0;
Class H2
virtual void fill(double x, double y, double weight=1.0) = 0;
Class Profile
virtual void fill(double x, double y, double weight=1.0) = 0;
Class Tuple
  virtual Column* column( const std::string &name, void* address, const std::string &columnlist ) = 0;
  virtual Column* column( void* address, const std::string &columnlist ) = 0; // for auto-generated name
  virtual void fill() = 0;
Class Column
For now the column value(s) are filled through the data structure address.
Should be implemented something like pointer- and name-base filling
virtual void fill(double v) = 0;
virtual void fill(const std::string &var_name, double v) = 0;
Code examples
Accumulation of data
//-----------------
// C/C++ Headers --
//-----------------
#include <string>
#include <iostream>
using std::cout;
using std::endl;
//----------------------
// Headers
//----------------------
#include "RootHist/RootHManager.h"
#include "PSHist/HManager.h"
#include "PSHist/Axis.h"
#include "PSHist/H1.h"
#include "PSHist/H2.h"
#include "PSHist/Profile.h"
#include "PSHist/Tuple.h"
#include "PSHist/Column.h"
#include "root/TRandom.h"
int main ()
{
cout << "Start main()" << endl;
// Non-equal bin edges:
double edges[]={0, 0.05, 0.1, 0.2, 0.25, 0.3, 0.5, 0.55, 0.7, 0.9, 1};
// Axis
PSHist::Axis axis1(60,0,1);
PSHist::Axis axis2(40,0,1);
PSHist::Axis axis3(10,edges);
PSHist::Axis axis4(100,0,1);
PSHist::HManager *hMan = new RootHist::RootHManager("pshist-test.root", "RECREATE");
// H1 - 1d histograms
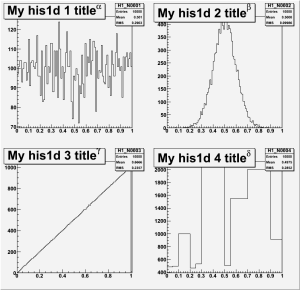
PSHist::H1 *pH1_1 = hMan->hist1i( "H1_N0001", "My his1d 1 title^{#alpha}", 100, 0., 1.);
PSHist::H1 *pH1_2 = hMan->hist1f( "H1_N0002", "My his1d 2 title^{#beta}", axis4 );
PSHist::H1 *pH1_3 = hMan->hist1d( "H1_N0003", "My his1d 3 title^{#gamma}", 100, 0., 1.01);
PSHist::H1 *pH1_4 = hMan->hist1d( "H1_N0004", "My his1d 4 title^{#delta}", 10, edges);
// H2 - 2d histograms
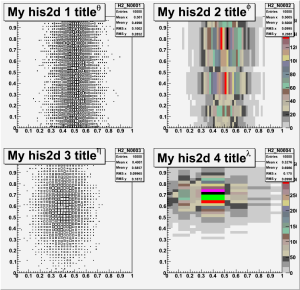
PSHist::H2 *pH2_1 = hMan->hist2i( "H2_N0001", "My his2d 1 title^{#theta}", axis1, axis2 );
PSHist::H2 *pH2_2 = hMan->hist2f( "H2_N0002", "My his2d 2 title^{#phi}", axis1, axis3 );
PSHist::H2 *pH2_3 = hMan->hist2d( "H2_N0003", "My his2d 3 title^{#eta}", axis2, axis2 );
PSHist::H2 *pH2_4 = hMan->hist2d( "H2_N0004", "My his2d 4 title^{#lambda}", axis3, axis2 );
// Profile - 1d profile histograms
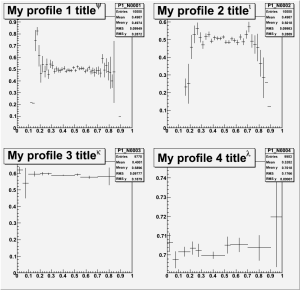
PSHist::Profile *pP1_1 = hMan->prof1( "P1_N0001", "My profile 1 title^{#psi}", 60, 0, 1, 0, 1 );
PSHist::Profile *pP1_2 = hMan->prof1( "P1_N0002", "My profile 2 title^{#iota}", axis2, 0, 1 );
PSHist::Profile *pP1_3 = hMan->prof1( "P1_N0003", "My profile 3 title^{#kappa}", 10, edges, 0, 1 );
PSHist::Profile *pP1_4 = hMan->prof1( "P1_N0004", "My profile 4 title^{#lambda}", axis3, 0, 1 );
// Tuple
PSHist::Tuple *pTuple = hMan->tuple( "TUPLE_N1", "My tuple title^{#alpha}" );
// Column (parameter(s)) for the tuple; use the ROOT-style constructor
double val;
float freq;
typedef struct {float x,y,z;} POINT;
static POINT point;
/*
PSHist::Column *pColumn_1 = pTuple->column( "C_N0001", &val, "EBEAM/D" );
pTuple->column( "C_N0002", &freq, "Freq/F" );
pTuple->column( "point", &point,"x:y:z" );
*/
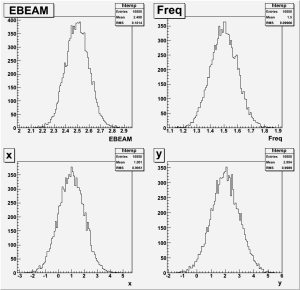
PSHist::Column *pColumn_1 = pTuple->column( &val, "EBEAM/D" );
pTuple->column( &freq, "Freq/F" );
pTuple->column( &point,"x:y:z" );
pColumn_1->print(cout);
cout << "Fill histograms" << endl;
for (int i=0; i<10000; i++)
{
pH1_1 -> fill( gRandom->Rndm(1) ); // Uniform distribution on [0,1]
pH1_2 -> fill( gRandom->Gaus(0.5, 0.1) ); // Gaussian for mu and sigma
pH1_3 -> fill( double(0.0001*i), double(i) );
pH1_4 -> fill( gRandom->Rndm(1) );
pH2_1 -> fill( gRandom->Gaus(0.5, 0.1), gRandom->Rndm(1) );
pH2_2 -> fill( gRandom->Gaus(0.5, 0.1), gRandom->Rndm(1) );
pH2_3 -> fill( gRandom->Gaus(0.4, 0.1), gRandom->Gaus(0.6, 0.2) );
pH2_4 -> fill( gRandom->Gaus(0.3, 0.2), gRandom->Gaus(0.7, 0.1) );
pP1_1 -> fill( gRandom->Gaus(0.5, 0.1), gRandom->Rndm(1) );
pP1_2 -> fill( gRandom->Gaus(0.5, 0.1), gRandom->Rndm(1) );
pP1_3 -> fill( gRandom->Gaus(0.4, 0.1), gRandom->Gaus(0.6, 0.2) );
pP1_4 -> fill( gRandom->Gaus(0.3, 0.2), gRandom->Gaus(0.7, 0.1) );
val = gRandom->Gaus(2.5, 0.1);
freq = gRandom->Gaus(1.5, 0.1);
point.x = gRandom->Gaus(1, 1);
point.y = gRandom->Gaus(2, 1);
point.z = gRandom->Gaus(3, 1);
pTuple -> fill();
}
hMan -> write();
delete hMan; // close file
}
Browse the ROOT file
In order to browser data stored in file we use a ROOT script proc-pshist.C:
//void proc(int Nplot=1)
{
  // Settings for good style
   gStyle -> SetPadColor(3);
   gStyle -> SetPadBorderSize(0);
   gStyle -> SetPadBorderMode(0);
   gStyle -> SetTitleXSize(0.05); // set size of axes titles
   gStyle -> SetTitleYSize(0.05);
   gStyle -> SetTitleH(0.1); // set size of the title in top box

  TFile *f = new TFile("pshist-test.root");
         f -> ls();

  //------------------------------------

  c1 = new TCanvas("c1","",0,0,800,800);
  c1->Divide(2,2);

  c1->cd(1); H1_N0001->Draw();
  c1->cd(2); H1_N0002->Draw();
  c1->cd(3); H1_N0003->Draw();
  c1->cd(4); H1_N0004->Draw();

  gPad -> Update();

  //------------------------------------

  c2 = new TCanvas("c2","",200,0,800,800);
  c2->Divide(2,2);

  c2->cd(1); H2_N0001->Draw("box");
  c2->cd(2); H2_N0002->Draw("COLORZ");
  c2->cd(3); H2_N0003->Draw("box");
  c2->cd(4); H2_N0004->Draw("COLORZ");

  gPad -> Update();

  //------------------------------------

  c3 = new TCanvas("c3","",400,0,800,800);
  c3->Divide(2,2);

  c3->cd(1); P1_N0001->Draw();
  c3->cd(2); P1_N0002->Draw();
  c3->cd(3); P1_N0003->Draw();
  c3->cd(4); P1_N0004->Draw();

  gPad -> Update();

  //------------------------------------

  c4 = new TCanvas("c4","",600,0,800,800);
  c4->Divide(2,2);

             TUPLE_N1->Print();
  c4->cd(1); TUPLE_N1->Draw("EBEAM");
  c4->cd(2); TUPLE_N1->Draw("Freq");
  c4->cd(3); TUPLE_N1->Draw("x");
  c4->cd(4); TUPLE_N1->Draw("y");

  gPad -> Update();

  //------------------------------------

  c1 -> Print("plot1.gif"); // works for gif, eps, etc.
  c2 -> Print("plot2.gif");
  c3 -> Print("plot3.gif");
  c4 -> Print("plot4.gif");

  //------------------------------------

  cout << "Sleep for 10 sec..." << endl;
  gSystem->Sleep(10*1000);
  cout << "Wake up, and exit root." << endl;

  f -> Close();
}
To run this script use command
root -q -f proc-pshist.C
This script draws four canvas and saves them in files plot1.gif-plot4.gif,
Overview
Content Tools