Looking at the annual ping packet losses measured from SLAC to Russia (see figure below) there is almost a factor of 10 increase in % ping losses from 2012 to 2013. This increase is also seen in the annual jitter (see below) and throughput. The throughput behavior follows directly from the loss since the throughput is derived from the inverse square root of the loss.
| Loss | Jitter |
|---|---|
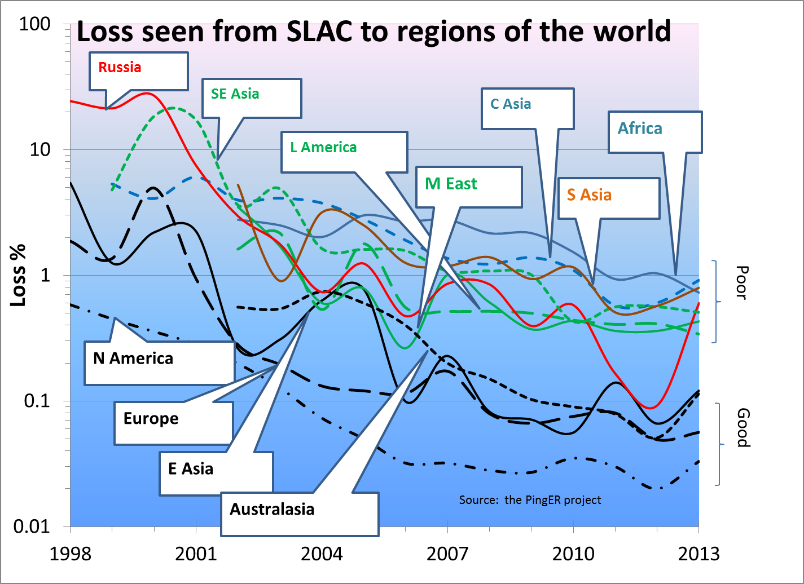 | 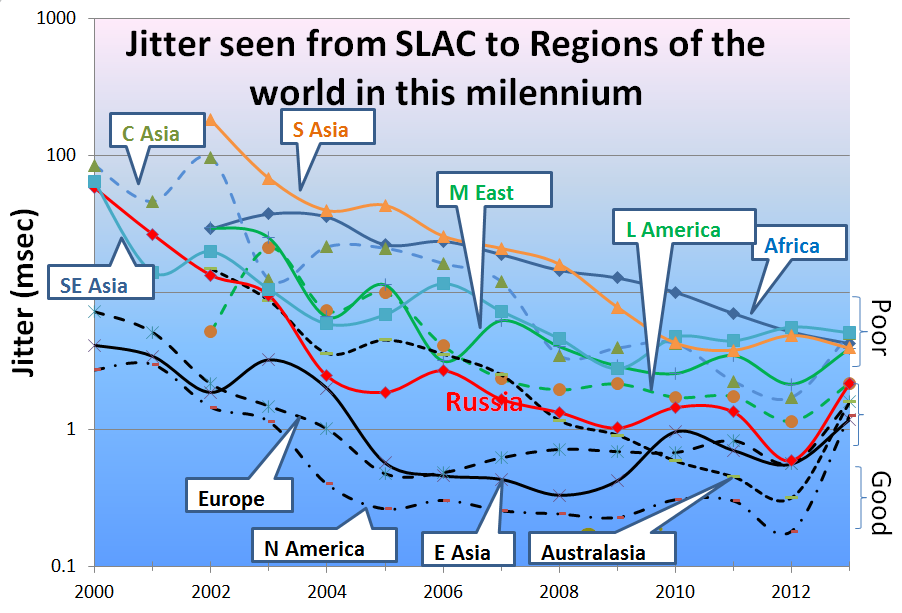 |
The table below shows the annual losses for the individual hosts. It is taken from a spreadsheet. The Route column indicates whether the route from SLAC to the Russian host goes Eastwards or Westwards.
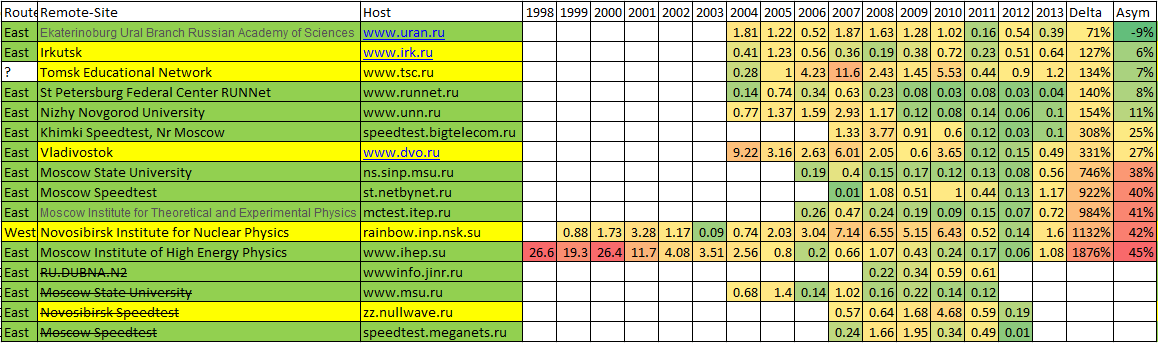
Looking at the Asymmetry between 2012 and 2013, in the column labeled Asym, it is seen that the main contribution to the increase comes from the hosts in Moscow and the one at Novosibirsk.
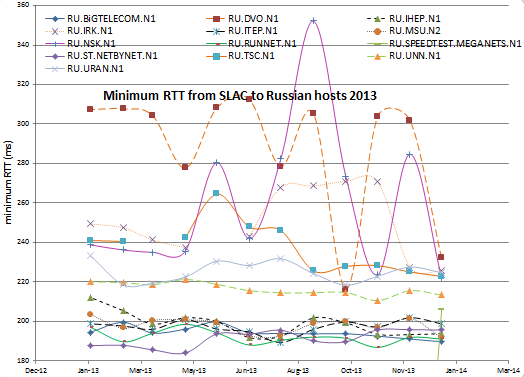
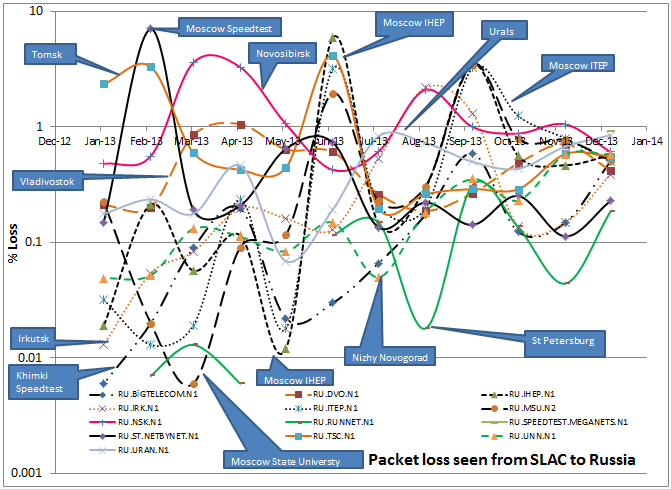
Looking at the monthly losses in the figure below (taken from a spreadsheet) large changes are seen in loss are seen month to month. Also one can observe the curves for Moscow ITEP, IHEP and the Sate University track one another fairly closely.
The relative small changes in monthly minimum RTT do not point to any major route changes for the hosts.
Looking at a spreadsheet of minimum RTT measured from SLAC to Russian hosts we can see below a chart. The curves for the East Russian hosts are in orange, those for St Petersburg and Nizhy Novgorod are in green and those for the Moscow region are in black.