The United Nations Development Program (UNDP), the International Telecommunication Union (ITU) and various other task forces are independent expert bodies which aim to provide policy advice, based on various economic factors, to governments, funding sources, and international organization for the purpose of bridging the Digital Divide. See the table below for details.
In reality, it is difficult to classify countries according to their development. The main challenges lie in determining what factors to consider, how to measure them, how useful and pervasive they are, how well defined they are, and whether they are uniformly measured for every country. Various organizations such as the ITU, UNDP, the Central Intelligence Agency (CIA), World Bank etc. have come up with Indices based on measured items such as life expectancy, GDP, literacy, phone lines, Internet penetration etc. Although many of the above challenges are not insurmountable they can require a lot of cost and time. Thus, many of these measurements are outdated and may not depict the current state of the country.
One of the most important factors determining the economic development of a country in today’s information age is its Internet connectivity. Thus we may expect moderate to strong correlations between the economy and development of a country with its Internet performance measurement. The significance of using PingER’s Internet measurements to characterize a country’s development is due to the fact that PingER’s data is current (up-to date within a day or so compared to say the most recent Information and Communications Technology (ICT) Development Index[1] (IDI) data from the ITU that was published in 2012 and was measured in 2011) and covers countries of the world. Also PingER’s data is very objective not relying on statistics reported by governments with possibly vested interests. From the many indices available[2], we chose the IDI since it is one of the most current, it is clearly related to Internet connectivity, and covers many of the countries covered by PingER. A bubble plot of throughput vs. the IDI access sub-index[3] with the bubble sizes being proportional to population is shown in Figure 1.
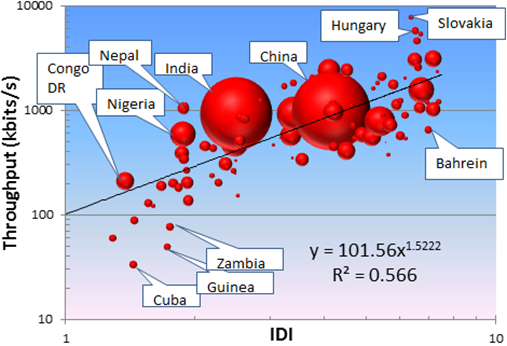
Figure 1: Pinger Derived Throughput vs. the ICT Development index. The bubble size is proportional to the country's population.
The black line is a trend line fit to a power series with the parameters shown. It is seen that there is a fairly strong correlation (R2=0.566 or R=0.75) between the IDI and PingER derived throughput.
[1]Measuring the Information Society, from the ITU , see http://www.itu.int/ITU-D/ict/publications/idi/2011/
[2] Table 4 “ICFA SCIC Network Monitoring Report, 2012”. see http://www.slac.stanford.edu/xorg/icfa/icfa-net-paper-jan12/report-jan12.docx
[3] The IDI access sub-index measures ICT infrastructure and readiness. It includes: fixed-telephone subscriptions per 100 inhabitants, mobile-cellular telephone subscriptions per 100 inhabitants, international Internet bandwidth per Internet user, percentage of households with a computer and percentage of households with Internet access at home