Also see Performance Comparisons under PingER case Studies.
The Household Download Index from Ookla is based on millions of recent test results from Speedtest.net, this index compares and ranks consumer download speeds around the globe. The value is the rolling mean throughput in Mbps over the past 30 days where the mean distance between the client and the server is less than 300 miles. We downloaded the data for ~180 countries from Ookla on December 7th, 2013. Using an Excel spreadsheet we compared these results with the PingER derived throughput averaged over 2013.
A bubble plot comparing the measurements is shown below. The X-axis is for the PingER derived throughput, the Y-axis for the Speedtest download speeds. The bubble size is proportional to the population. The trendline is a power series fit to the data.
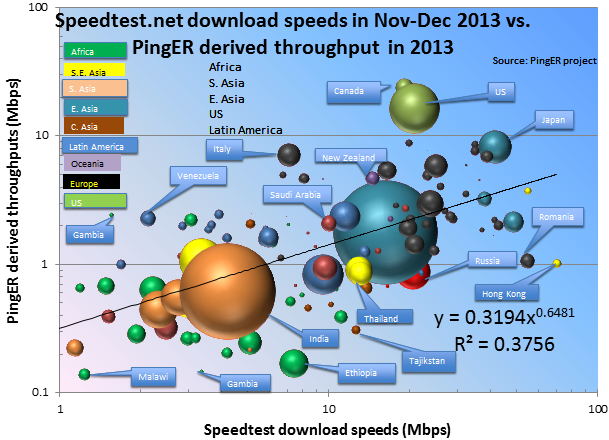
As might be expected the PingER values are lower than those of Speedtest since Speedtest measurements are made from within 300km (and thus lower Round Trip Times) than the PingER measurements made from SLAC with distances up to 11,000km . Thus measurements from SLAC in the US (shorter distances) to the US have better agreement,. Despite the differences in measurement time window, and measurement method there is a positive correlation (R2=0.38)between the results.