Introduction
This is a proposal for a Run Plan for the May 2009 3D TestBeam at CERN/H8. The main focus of the testbeam will be the measurement of the 3D sensor characterics within a magnetic field. Sensors will be positioned inside the Morpurgo Super Conducting Dipole magnet (1.9T).
However, if the main focus should be measurements within magnetic field, two new sensors from FBK and CNM will be tested for the first time in beam. These new sensors should be compared to the Stanford reference sensor with magnetic field on as well as magnetic field off.
Sensors
we are planning to test 4 sensors in parallel:
- Stanford 3E reference sensor (tested in beam in 2008)
- Planar reference sensor
- New 3D FBK sensor
- New 3D CNM sensor
Test Beam and ATLAS sensor positioning
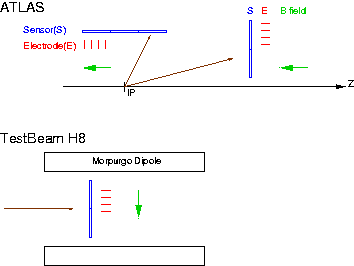
Below is a cartoon of the positioning of the 3D sensors, both in ATLAS (barrel and endcap region) and in H8:
In ATLAS, the magnetic field is parallel to the 3D Electrodes in the EndCap region and perpendicular in the barrel region. The testbeam will therefore test the ATLAS barrel configuration.
Expected effects due to the magnetic field
In the barrel region, given the direction of the E and B fields, charges will be drifted to the surface of the sensor, and will be trapped, recombined, etc... in the p-spray layer (or the oxide layer?). What happens there is not fully understood (by me!). Some charges will be collected by the read-out electrodes (some in-time but some delayed), and some won't. The effect is therefore a loss of efficiency. In the barrel region, contrary to planar sensors, there is no charge sharing effect.
Question: do we need to understand what happens when charges are drifted to the surface of the sensor, and what measurement could we do to quantity the effect?
As Chris pointed it out, the effect will of course depend on the magnitude of the field but also on the sensor itself. That's why it important to test the sensors for various magnetic field (at least 1.9T and 0T, but also possibly with one or two more points in between).
Proposed Run Plan
Measurements to be performed at each setting:
Most of the measurements will be performed at each sensor configuration:
-
- Overall efficiency
- Efficiency map
- Charge sharing, overall and map
- Pulse height distribution, bulk and electrode region
- other
Statistics needed at each sensor configuration
The assumption here is based on achieving a statistical error of 1% on the overall efficiency for each sensor configuration. It seems a reasonable number when comparing efficiencies as a function of the bias voltage for example. This means that we need about 10000 good tracks (reconstructed and going through the center part of the sensors). Based on the 2008 TB data taking experience, the efficiency of reconstructing good tracks from all triggers is about 20%. Assuming that 5K triggers are recorded in 20 minutes, we will need a bit less that 4 hours. Let's round to 4 hours.
Scans
Again, we should keep in mind that we will test two new sensors. For example, the depletion voltage for these new sensors is not precisely known. All quantities (in particular the overall efficiency) should be measured as a function of the Bias Voltage, B field and Beam incident angle:
-
- Bias voltage: we propose 8 values. For the Stanford reference sensor (with depletion voltage around 10V): 2,5,10,15,20,30,40,60 V. For the two new sensors, as the depletion voltage is not precisely known, we can either do the same scan or do a binary scan in order to get more points around the knee (low bias, then high bias, then in the middle, then depending how the efficiency varies, more point in the first or in the second bin).
- B field: the minimum is two steps: 0T and 1.9 T (maximum dipole field, ATLAS being 2T). If time permits, it would be useful to take one or two steps.
- Beam incident angle: What is the maximum angle achievable? In 2006, two steps were done: at 0 and 15 degree. We could repeat that, but if time permits an additional step at higher angle would be useful.
Summary:
If we want to perform all measurements at each scan step of the bias voltage, B field and beam angle, and assuming a 50% data taking efficiency:
8 (Bias V) x 2 (B field) x 2 (beam angle) x 4 (hours) / 50% = 256 hours = 11 days. The testbeam is 15 days, so we should have enough time.
One way of gaining time (and this could be the minimum run plan), would be not to do Bias scan at all beam angles, and take 2 bias steps at the 15 degree incident angle:
[ 8 (Bias V) x 2 (B field) x 1 (beam angle) x 4 (hours) + 2 (Bias V) x 2 (B field) x 1 (beam angle) x 4 (hours)] / 50% = 160 hours = 7 days.
It has to be checked if 4 hours are sufficient for the high statistics measurements, such as the efficiency maps. The high statistics measurements do not have to be done at each setting/scan step, so we can certainly envisage to spend more time on several scan steps. Similarly, we can envisage to take more steps in B field and Beam incident angle for a few bias voltage settings only.
