ref: http://cs231n.stanford.edu/slides/winter1516_lecture8.pdf
This is something we are very interested in, however we tend not to pursue it along these directions since it is for the most part treated as a supervised learning problem, that is someone annotates training images to put boxes or polygons around the objects that are meant to be found. We assume this is an expensive operation, and maybe it is, but some points
- don't need as much labeled localization data as you do labeled data for classification
- that is build a classifier with the large amount of training data that labels classes
- now use transfer learning to learn a less complicated model from the smaller amount of labeled localization data
Annotating
-maybe not as expensive as one thinks, options
- http://labelme.csail.mit.edu/
opensource tool for labeling, I labeled 250 xtcav images. You can only upload 20 at a time, this is tedious. You have to give each box a name, which takes unnecessary time for our problem. I'd estimate 8 seconds per box, some images have two boxes, some 1. - mechanical turk - the labelme website talks about using this: http://labelme2.csail.mit.edu/Release3.0/browserTools/php/mechanical_turk.php
in particular they report a price per image of only 1 penny? And I think those images are more complicated than ours
Good Results with Little Training Data
Here is what it looks like to work in labelme - note labelme only takes jpg to the image quality is poorer:
Here is a visualization of the 250 training images. All 250 images are summed up, and all localization boxes for the are plotted. This gives a sense of the how the boxes are distributed so we can gauge how hard the regression problem is, of predicting boxes. These lasing images are plotted "right side up", that is with the fingers going down - e1, the earlier time arrival, higher energy, is the white boxes on the top of the image (they were the bottom of the labelme images) and e2, the later time, lower energy, are the green boxes on the bottom of the image
The localization proceeded as follows
- freeze the vgg16 model, record the codewords - that is the last two fully connected layers (each has 4096 units)before the layer of 1000 logits used to discriminate the imagenet classes.
- Use these 8192 values as the feature vector for the regression.
- Identify the subset of the 250 samples where a e1 box was labeled.
- Likewise the subset of the 250 samples where a e2 box was labeled.
- Do a 90/10 split each dataset into train/test (this was 13 test samples for e1, about 23 for e2)
- Build separate regressors for each of these X,Y sets
- rows of X are vectors with 8192 values
- rows of Y are vectors of 4 values - xmin, xmax, ymin, ymax for the bounding box
- Just do linear regression, that is produce a model with 4*8192 parameters from the 200ish*8192 input values
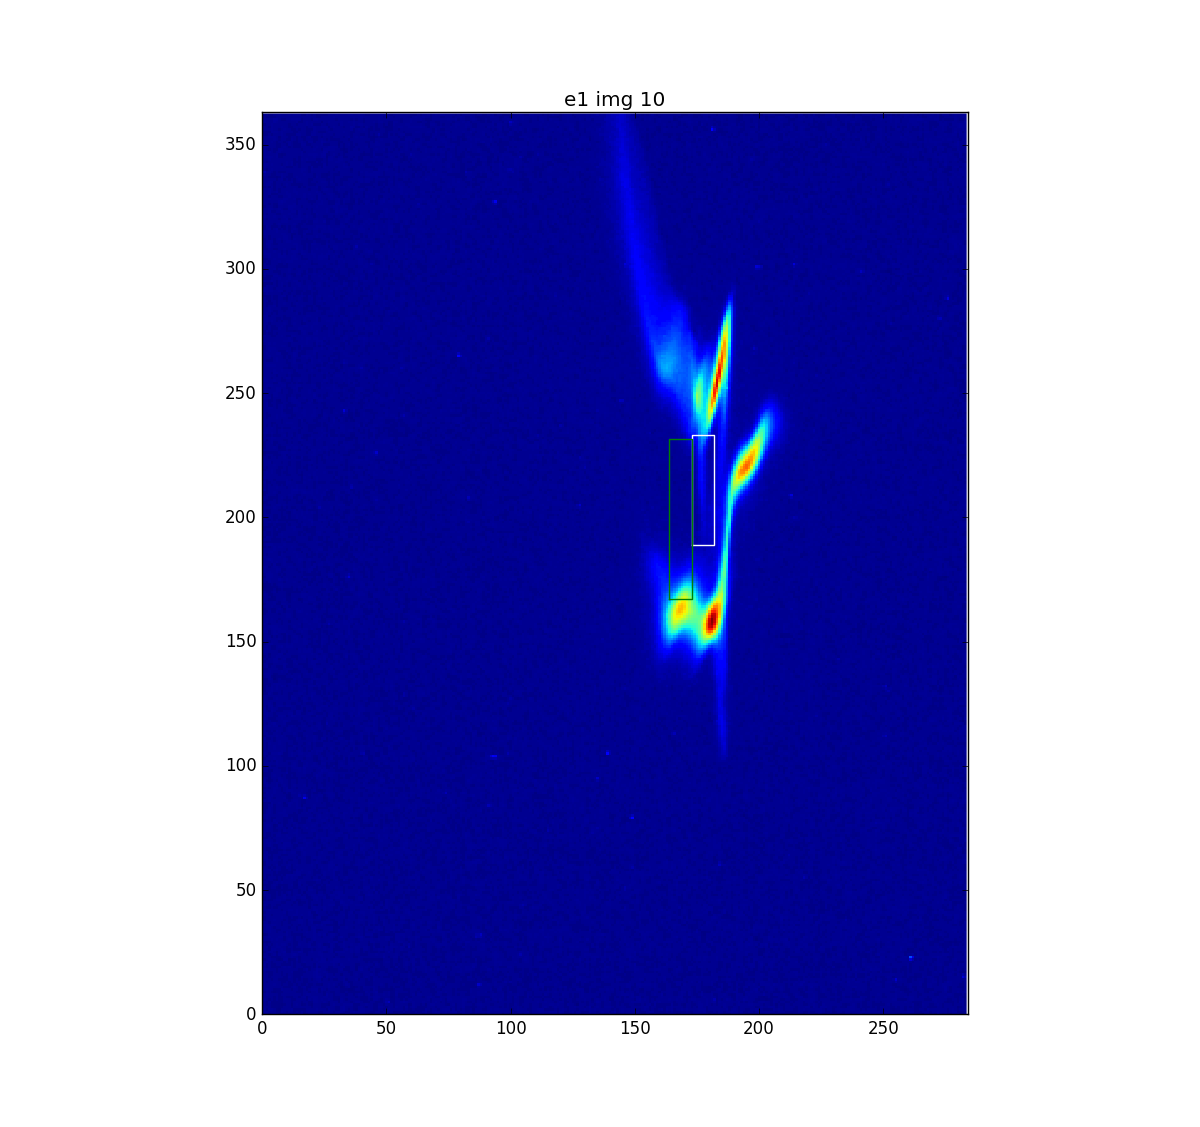
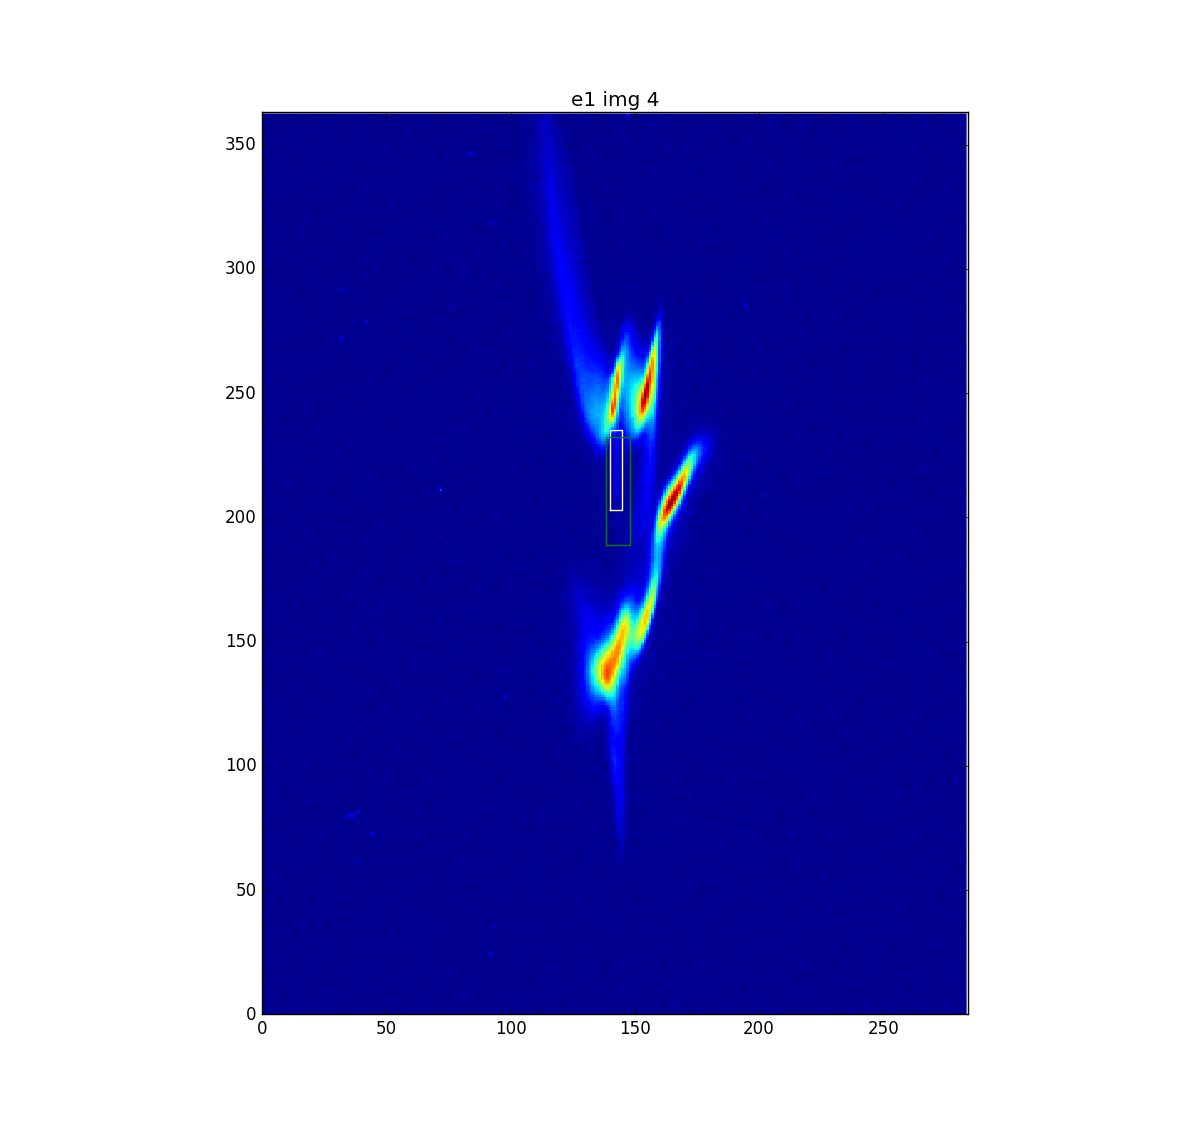
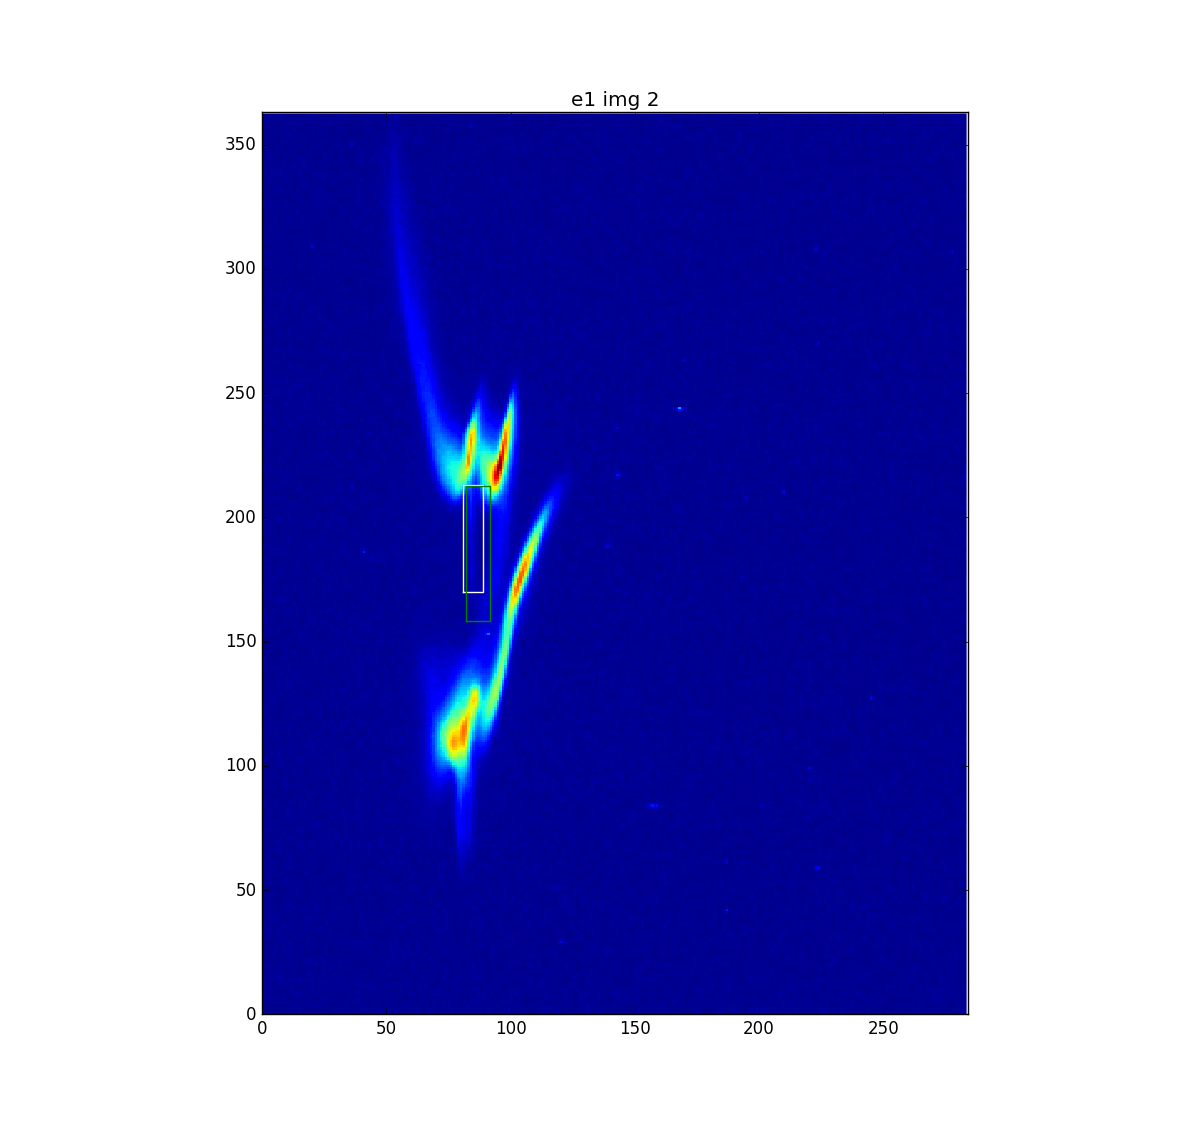
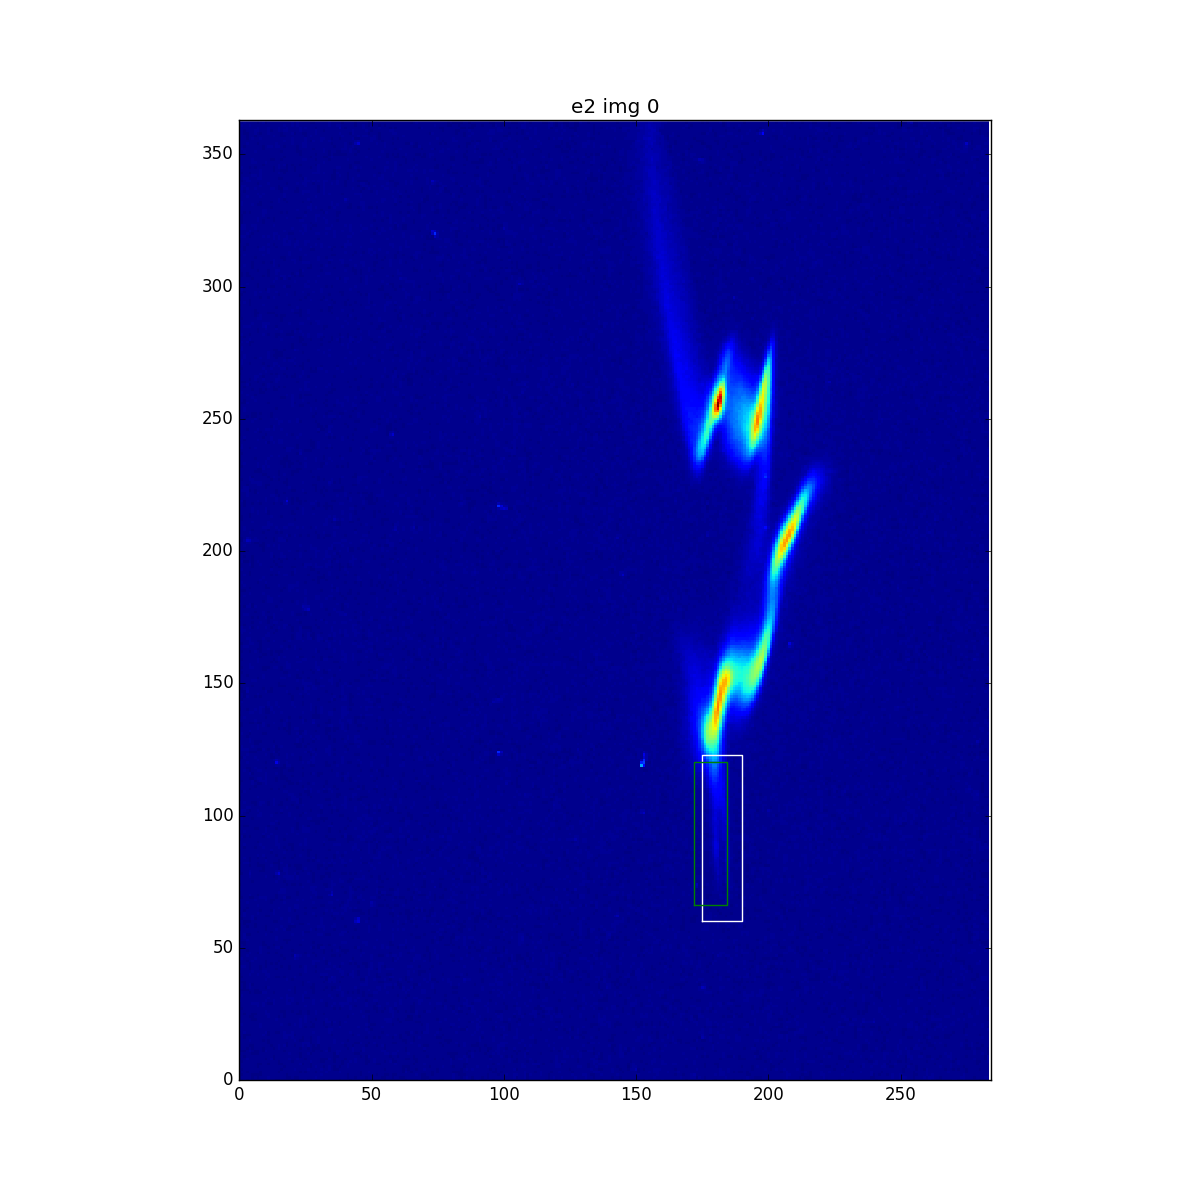
Below we plot results. Overall, the predicted boxes, always in green, look surprisingly good. I only found one 'bad' one for each of e1, and e2, which I plot below.
e1 images
This is the one bad one - the 10th of about 13 test images
e2 images
images


