R. Les. Cottrell, SLAC and Umar Kalim SEECS/NUST
Introduction
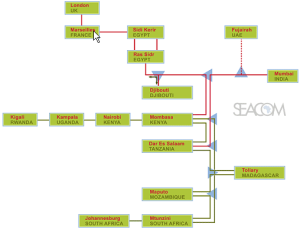
With the 2010 Soccer World Cup fast approaching the Seacom undersea fibre optic cable, plugging East Africa (Network Schematic) into high speed Internet , went live on Thursday July 23, 2009 - as reported by the BBC and CNN. Such a cable should dramatically reduce the cost of bandwidth measured in $/Mbps, reduce the Round Trip Times (RTT) from >~ 480 ms for a geostationary satellite, down to 200-350ms (seen from N. America) by using shorter distance terrestrial routes. Also by increasing the capacity reduce the congestion and thus the losses and jitter.
In this case study we look at the current state of Internet access for Africa as measured by the PingER project and also at the effect of the new submarine cable connections on the RTTs to countries of Africa as seen from the SLAC National Accelerator Center near San Francisco. The main effects seen so far are on the RTTs for selected sites that have converted to using the terrestrial links. As the new routes stabilize and more and more customers, e.g academia and commercial organizations, subscribe to the service, we can expect to also see lower losses and jitter and higher through-puts together with a wider impact on deployment.
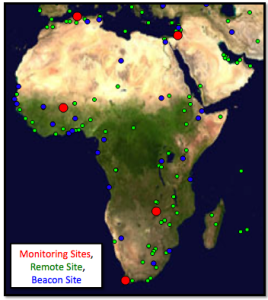
PingER monitors over 165 sites in 50 African countries, that contain about 99% of Africa's population. The African countries that are not currently monitored are Chad, Comoros, Equatorial Guinea, Sao Tome & Principe and Western Sahara. The results from PingER are used heavily in this study. Below is seen a map of the PingER sites in Africa. The red dots indicate PinGER monitoring sites, the blue are beacon sites that are monitored by most of the over 40 PingER monitoring sites around the world, and the green are other sites monitored by at least one monitoring site.
This study first outlines the new submarine fibres coming into place for E. Africa. It goes on to summarize the current state and trends of Internet performance for Africa and the costs particularly for Sub_Saharan and E. Africa. Following this we discuss the role of the emerging National Research and Education Networks (NRENs) and traffic routing. Then we look at the RTTs of hosts in Kenya and Tanzania on the day following the start of operation of the Seacom cable, the identification of further hosts of interest, followed by the changes in RTTs as hosts later moved their routing from satellite to terrestrial routes.
Submarine Fibre Cables for E. Africa
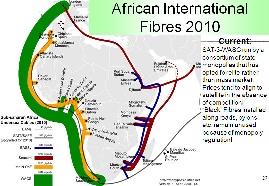
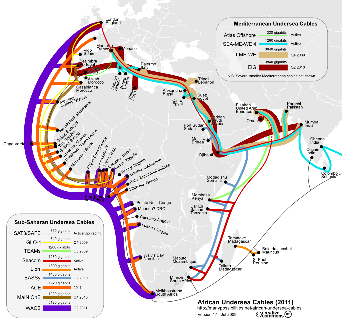
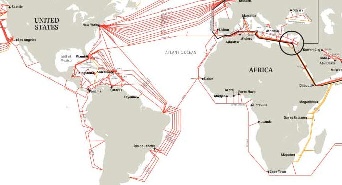
At the moment the SAT-3/WASC/SAFE fibre has been in place for some time and connects up several countries on the W. Coast of Africa. Up until now however, there have been no fibres on the East Coast of Africa. The Seacom line is not the only fiber-optic cable project on Africa's East coast — others include the Eastern Africa Submarine Cable Systems (EASSY), The East African Marine System (TEAMS)and Lion — but it will be the longest and have highest capacity (1.28 terabytes per second). The EASSY and TEAMS are designed to build out African telecommunications networking, but Seacom is the only line that directly will connect east coast urban areas in Kenya, Madagascar, Mozambique, South Africa and Tanzania to France and India. TEAMS landed in Mombasa early June 2009 and is currently undergoing testing while EASSY and Lion are expected to be operational by mid-2010. Maps of the various fibres is shown below, more details are available here. Also shown is network schematic of the Seacom link.
|
Seacom Network Schematic |
|
|
|
|
For the interior backbones (or backhauls) associated with these landing points, see here.
Current State of the African Internet
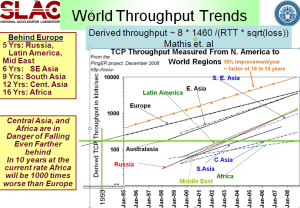
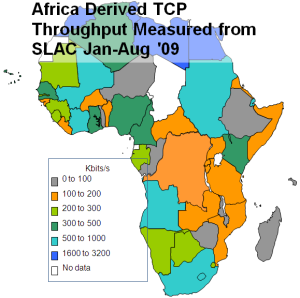
The derived throughputs measured to Africa from N. America for the last decade are shown below in the left hand figure. It is seen that not only do African sites lag the rest of the world in throughput, being roughly in the state that European sites were over a decade and a half ago, but also they are falling further behind with time. Further, bear in mind that for Africa, Mediterranean countries and South Africa have the better perfomance and E. Africa is the worst off (see the the middle map below). Thus the arrival of a terrestrial submarine fibre cable link to the rest of the world for E. Africa is a very significant development.
The minimum RTTs measured from SLAC to African countries in August 2009 are seen in the map on the right
<ac:structured-macro ac:name="unmigrated-wiki-markup" ac:schema-version="1" ac:macro-id="057327c6-a2f5-4d80-921e-c82192c43803"><ac:plain-text-body><![CDATA[ |
Throughput from SLAC to Regions of the World |
Derived Throughput from SLAC to Africa Jan-Aug '09 [[xlsx |
^africa-thru-aug09.xlsx]] |
MinRTT from SLAC - Aug. 2009 [[xls |
^map-africa-minrtt-aug2009.xls]] |
]]></ac:plain-text-body></ac:structured-macro> |
|---|---|---|---|---|---|---|
|
|
|
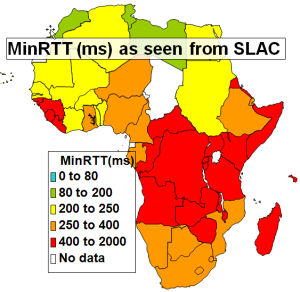
The striking number of countries in Eastern and Central Africa with minimum RTTs of >400ms is indicative that they were using GEO-Stationary (GEOS)satellite links.
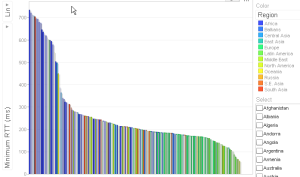
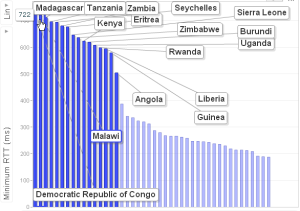
Another way of illustrating which countries are using satellites is to look at a bar chart of the PingER measured minimum RTT in the fuirst half of 2009 for each country sorted by the minimum RTT. Such a chart is shown below on the left. It is seen that there is a steep rise around 400ms as one moves to GEOS satellite connections. The predominance of African countries (blue) with large minimum RTT is also apparent. If one creates the same type of bar chart but only using African countries then the result is seen on the right below where the countries with a minimum RTT > 450ms are labelled.
PingER Minimum RTT for Countries of the world in the first half of 2009 |
PingER Minimum RTT for African Countries in the first half of 2009 |
|---|---|
|
|
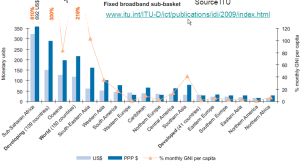
East Africa contains 300M people, yet less than 3% are Internet users (see Internet usage for Africa). Bandwidth in Africa is very expensive. See for example the left hand figure below where it is seen that bandwidth costs for broadband in Sub-Saharan Africa are 30-40 times that in the US. Taken together with the earnings differences, what takes say 15% of a US Gross National Income (GNI) per capita will take over 800% of a Sub-Saharan GNI per capita.
Costs of Broadband Internet Access in Countries of the world. |
|---|
|
Emergence of National Research and Education Networks (NRENs) & Routing
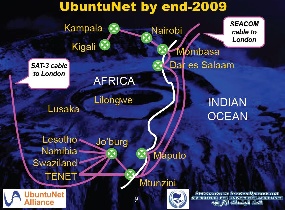
In the past the area has had poor Internet connectivity with heavy use of expensive (in terms of $/Mbps) geostationary satellite connections to the outside world. (see above) In addition most of the traffic between countries made use of expensive international links via Europe and the U.S. rather than more direct connections. There are active movements to create National Research and Education Networks (NRENs) in the area, see for example "Sub-Saharan Africa: An update" by Boubaker Barry. This, together with direct connections between countries will enable more direct peering. These NRENs in turn are peering with the GEANT network in Europe through the Ubuntunet Alliance. The map on the left below shows the state of African NRENs in 2008, the map in the middle shows the Founding Ubuntunet Alliance members and those who have joined since the founding, the figure on the right shows the prediction (in October 2008) for the state of Ubuntunet connections at the end of 2009..
NRENs in Africa |
Ubuntunet Alliance |
Ubuntunet End 2009, from Duncan Martin |
|---|---|---|
|
|
|

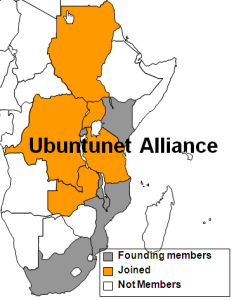
It can be seen that NRENs are being created.
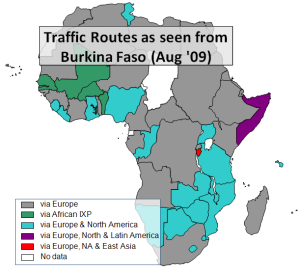
To understand the importance of NRENs and IXPs to reduce the use of intercontinental providers to get between African countries, we can look at the state of direct connections between African countries by measuring the traceroutes within Africa. Below on the left and in the middle are the routes taken from South Africa to other African countries in September 2005 and August 2009 and on the right the routes from Burkina Faso to other African countries in August 2009. In the middle map countries which were only accessible by satellite have horizontal shading lines.
<ac:structured-macro ac:name="unmigrated-wiki-markup" ac:schema-version="1" ac:macro-id="46679458-8eae-430d-8050-bbd87b3f49bb"><ac:plain-text-body><![CDATA[ |
Routing from South Africa to African Countries (Sep '05) |
Routing from South Africa to African Countries (Aug '09) [[xls |
^routing-africa-aug2009.xls]] |
Routing from Burkina Faso to African Countries (Aug '09) [[xls |
^routing-africa-aug2009.xls]] |
]]></ac:plain-text-body></ac:structured-macro> |
|---|---|---|---|---|---|---|
|
|
|
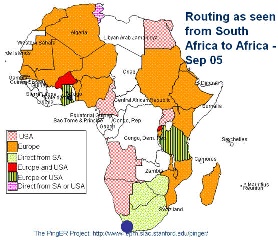
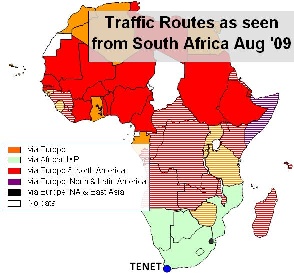
In September 2005 most traffic from South Africa to the rest of Africa took costly international links, only Botswana and Zimbabwe had direct routes. The situation has improved recently as direct routes from South Africa to Namibia and Botswana were added. More details on the routes to African countries from several measurement points around the world measured in Spring 2009 can be seen in a spreadsheet of African routing and inferences.
Connections from Burkina Faso in August 2009 were direct to only Senegal, Mali, and Benin (in green). Most other countries in grey were reached by intercontintal connections via Europe, followed by many in teal that go via Europe and N. America. Somalia was reached via Europe, N. and S. America. Burundi was reached via Europe, N. America and E. Asia.
Initial Results on First Day
One would expect with the use of a terrestial fibre rather than a geo-stationary satellite that the minimum RTT woud be reduced from >=400ms to 200-300ms as seen from the US. Also the reduced congestion enabled by the higher speed links should make the average RTT more stable and reduce the packet loss. Below are shown the average RTTs and losses from SLAC on the West Coast of the US to various hosts on the East Coast of Africa. These are all measured using the PingER project's data.
|
acheraarchitects.co.ke |
loans.co.ke |
elearning.braeburn.ac.ke |
|---|---|---|---|
Kenya |
|
|
|
|
www.micti.co.mz |
www.uem.mz |
|
Mozambique |
|
|
|
|
www.muchs.ac.tc |
www.6telecoms.co.tz |
www.acet.or.tz |
Tanzania |
|
|
|
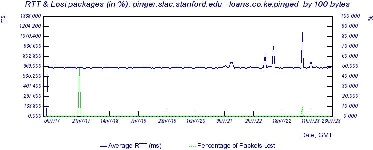
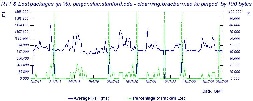
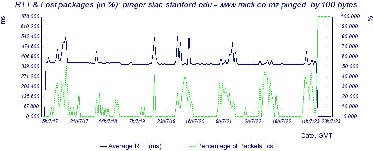
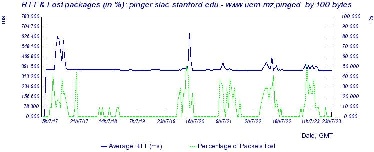
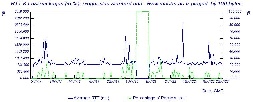
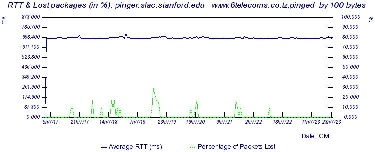
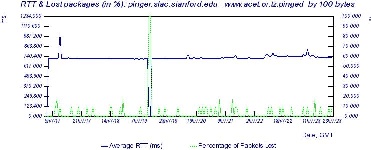
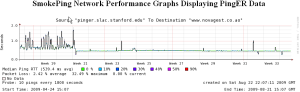
It is apparent we do not observe any dramatic reduction in RTT on July 23rd. We also looked at the PingER recorded RTT from ICTP Trieste, Italy to a host in Tanzania in case the routes from SLAC were still using satellite while those from Italy were not. We also looked at the RTT seen from a TENET host in cape Town South Africa to a host in Mozambique. In this case (see below) the RTTs have long been << 400ms so they already were not using geostationary satellite to connect the sites.
www.muchs.ac.tz From Trieste |
www.micti.co.mz from Cape Town |
|---|---|
|
|
Again there is no dramatic reduction. looking at the TENET to www.micti.co.mz RTTs it is apparent that there is a direct (non geo-stationary) satellite connection between the two sites since the RTT << 400ms.
According to the BBC report five institutions are already benefiting from the faster speeds - national electricity company Tanesco, communications company, TTCL, Tanzania Railways and the Universities of Dar es Salaam and Dodoma. we also heard from Alem who was visiting Kenyata University from Ethiopia for a one day conference that "You can get connected and download data like what you can do in Europe."
From SLAC, we pinged hosts at each of these organizations, the Round Trip Time (RTT) results in msec. are shown below: For the # pings with an asterisk the host did not respond to pings so we used synack to probe the web server:
Country |
Organization |
Host |
# pings |
Min RTT |
Avg RTT |
Max RTT |
Std dev |
Loss |
|---|---|---|---|---|---|---|---|---|
Tanzania |
Tanzania railways |
www.trctz.com |
100 |
764 |
790 |
893 |
19.5 |
0% |
Tanzania |
Tanzania Telecommunications Company |
www.ttcl.co.tz |
100* |
714 |
721 |
730 |
4.3 |
1% |
Tanzania |
University of Dar Es Salaam |
www.udsm.ac.tz |
151 |
696 |
711 |
1130 |
45 |
0% |
Tanzania |
University of Dodoma |
www.udom.ac.tz |
100* |
753 |
783 |
845 |
18 |
0% |
Tanzania |
Tanesco National Electric Company |
www.tanesco.com |
49 |
12.6 |
12.997 |
13.53 |
0.251 |
0% |
Kenya |
Kenyatta University |
www.ku.ac.ke |
138 |
650.138 |
652.36 |
668.44 |
1.97 |
2% |
The host www.tanesco.com is probably a proxy located somewhere in the Western US. The other hosts all have minimum RTTs of well over 400ms which indicates they are probably still using a geo-stationary satellite.
When looking at the lack of effects seen initially following the fibre install it is important to understand the caveats.
To enable easier selection and looking for changes for these East African Coastal countries, we added a PingER affinity group (E.AFRICA_COAST) for hosts monitored in Kenya, Mozambique and Kenya. The minimum RTT should be very sensitive to a change in the route from a geo-stationary satellite to a terrestrial fibre link. An example of selecting data sensitive to the E. African fibre connection can be seen in the table of PingER daily minimum RTT data for the group E.AFRICA_COAST. This data is updated daily.
Adding Extra Hosts
We received suggestions from Don Riley of UMD:
I would be watching kdn.co.ke, kenet.or.ke in Kenya. maybe also Univ. of Nairobi.
KDN should change soon, since they're connecting directly to SEACOM and lighting fiber to Uganda and Rwanda. KENET should be first on the university side, I think. and Univ. of Nairobi - typical for lead univ. in capitol to come up first. Similar in TZ and MZ, but looks like you've got the right lead univ's there. Would probably track MORENET and TERNET there.
We have been monitoring kdn.co.ke so we will have a nice history and see the change.
Kenet.or.ke does not respond to pings, using synack the response time to its web server (kenet.or.ke:80) on 7/25/09 was about 667ms.
For the University of Nairobi I Googled it and got www.uonbi.ac.ke however it has an RTT of 78ms from SLAC and appears to be in Virginia USA. Instead I added library.uonbi.ac.ke that is a University of Nairobi host that appears to be in Nairobi. On 7/25/09 it had an RTT of ~ 658ms.
I googled MORENET Mozambique and came up with morenet.mct.gov.mz. However it does not respond to pings. It does respond to synack on port 80 (www) and the response time to a trivial request is ~368ms so it may have already moved over. However GeoIPTool (see http://www.geoiptool.com/en/?IP=morenet.mct.gov.mz) says it's in Buenos Aires which I do not believe. Visualroute's (at http://visualroute.visualware.com/) tests fail. Looking at the traceroute from SLAC and using GeoIPTool to locate the nodes , it appears that on leaving the US the route goes directly from the West Coast of the US (Sunnyvale) through Buenos Aires (node telkomsa.ge9-16.br02.ldn01.pccwbtn.net 152ms) then to Pretoria (rrba-ip-lir-1-pos-1-0-4.telkom-ipnet.co.za 352 ms) and then to Mozambique. This it is not currently using the new fibreoptic cable running South down the E. African coast. Looking at a map of the world's undersea fibre cables in the region may help explain this.
I have added www.ternet.or.tz on 7/25/09 it had a ping RTT of 705ms.
We also added some hosts in Somalia.
Steve Song pointed out that a good PingER point would be the Durban University of Technology. They are the only university in South Africa to be currently connected to Seacom. All the rest are waiting for the development of the national SANREN backbone, later this year. I added www.dut.ac.za to the list of hosts monitored by PingER on 8/6/09. We will look to see whether we can see differences between it and other hosts monitored in South Africa.
Later Results Illustrating Impact of Changes
To assist in the selection of hosts in this region from the pingtable results, we created an affinity group that contains all hosts in Kenya, Mozambique and Tanzania. This makes it much simpler to look at the minimum RTT for just such hosts for the last few days
Uganda should be connected soon. KDN was building the fiber to Uganda and Rwanda. We therefore also set up a group for countries in the UN definition of Eastern Africa to simplify reviewing minimum RTT for all East Africa.
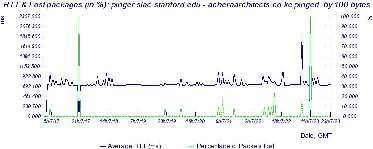
On Aug 2, 2009 following an email from Don Riley who had detected that kdn.co.ke had dropped to 370ms. We were Unfortunately not monitoring kdn.co.ke. However on further investigation we found the RTT from SLAC to acheraarchitects.co.ke (see below) had changed between 14:00 and 17:00 hours 6/1/09 GMT from a steady 716 ms to a steady 325ms. This is exactly what one would expect as the route moves from a GEOS to a terrestrial line. The traceroute from SLAC to Kenya went via ESnet to Sunyvale, then via Level3 to New York and London and thence to Kenya. The RTT between London and Kenya was about 200ms.
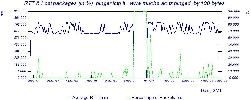
On Aug 1, 2009 at about 23:00 hours GMT the RTTs averaged over a day, from SLAC to www.ternet.or.tz changed from about 730ms to about 350ms (see below, note that the RTTs are truncated at about 900ms ). After about half a day it reverted back again. The traceroute when the RTT had reverted back to the high RTT value shows the route going through Telia and Newskies, a satellite services provider. The traceroute when the RTT was low was via ESnet to San Jose where it was picked up by Teleglobe to take the traffic to London and thence to Tanzania where it was passed to Tanzania Telecommunications.
On August 3, 15:00 hours www.ku.ac.ke dropped to about 370ms (see below), the earlier step change from 650ms to 550ms may have been since only one direction of the route was using the terrestrial line. The large difference by time of day indicate that there is probably still congestion somewhere in the route. A traceroute after the changeover shows the route going via ESnet to New York and via Level3 onto London, there it is transferred to InterRoute and is carried to Kenya by Seacom and thence to Nairobinet. According to http://www.interoute.com/news_and_events/news/1278 Seacom partners with Interoute.
On August 3, around 19:00 hours elearning.braeburn.ac.ke dropped from about 750ms to about 400ms (see below). The traceroute from SLAC to Braeburn is different from that to www.ku.ac.ke. It goes from SLAC via Esnet to Sunnyvale, crosses to Teleglobe and then to AS6453 to get to London. AS6453 is GLOBEINTERNET TATA Communications. In Kenya one of the nodes is Access Kenya which according to http://www.accesskenya.com/ "Access KenyaNews: ACCESSKENYA SETS AMBITIOUS TARGET OF 1MB GUARANTEED SPEED FOR THE AVERAGE CUSTOMER. ACCESSKENYA UPGRADES CORE NETWORK IN PREPARATION OF SEACOM AND TEAMS CAPACITY" (their capitalization.
By August 3rd, the average RTT from SLAC to mail2.starcom.co.ug in Kampala Uganda reduced from about 780ms to about 540ms. On August the average RTT dropped further to about 380ms. Possibly in the intermediate state (540ms) only one direction was using the fibre. The traceroute measured on 8/15/09 shows the route going via ESnet to Sunnyvale then onto San Jose and Level3 that carries it to New York and London, the next hop is in Nairobi an Intersat Africa node. Hop 18 is also in Nairobi and hop 19 in Kampala. Looking at the time series of the average RTT below it is not clear the route has fully stabilized yet.
acheraarchitects.co.ke |
ealearning.braeburn.ac.ke |
www.ku.ac.ke(26 Jul-Aog 20, '09) |
|---|---|---|
|
|
|
www.ternet.or.tz (RTT truncated at 900ms) |
www.ternet.or.tz (untruncated) |
|
|
|
|
mail2.starcom.co.ug |
Mail2.starcom.co.ug (Jun 30-Aug 20, '09) |
|
|
|
|


Other Nearby Countries
Similar effects (dramatic reduction in RTTs) have also been observed for other sites at countries in Africa.
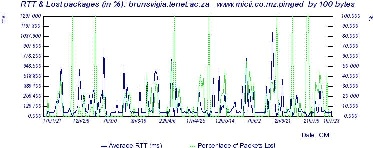
For example on May 19th 2009, www.novagest.co.ao one of 4 sites PinGER monitors in Angola reduced the average RTT from about 750ms to 450ms and became much more stable (less jitter) in the process (see the time series in the figure below).
Similarly the average RTTs of both hosts that PingER monitors in Mozambique dropped from 780ms to about 360 ms in June 2007.
On the other hand hosts in Namibia (such as www.adsl.com.na seen below) seem to be switching between using a long RTT path from SLAC and a shorter one.
Angola: www.novagest.co.ao |
Namibia: www.adsl.com.na |
|---|---|
|
|
