Problem Statement:
In tri-lateration and multilateration based Geo location algorithms, the correct estimation of the location of any target node depends on the correct mapping of delay to distance. When we get RTT values from landmarks to the target node, the next important step is to map this RTT value to a distance that can correctly represent the radius of the circle drawn around that particular landmark. Since, the overlapping area of the circles is used to estimate the location (latitude, longitude) of the target node, the correct estimation purely depends on the radius of circles drawn.
Thus we need to find a suitable correlation between the delay measurements and the distance values. There are various factors affecting the RTT values including: propagation delays; router forwarding and queuing delays; unavailability of great circle path; presence of satellite connections etc. These make it impossible or at least difficult to reach to a single common factor which could be used in the delay to distance mapping. The paper on "An Investigation of Geographic mapping Techniques for Internet Hosts" claims there is considerable correlation. Examples of how distance correlates to RTT can be seen in the CAIDA RTT vs Distance results. Also see The Large-Scale Geography of Internet Round Trip Times .
We know that digital information travels in fiber at a speed of 0.6 times the speed of light in vacuum. Thus we can say that 1ms of RTT can equal roughly 100Km distance. But in order to tackle the additive distortions in RTT values due to the various delaying factors mentioned above, use of this 100Km/ms alpha value results in a large over estimation. As a result many geolocation location techniques, such as Octant, Constraint Based Geolocation, Topology Based Geolocation use much smaller values of 40-60 Km/ms for alpha.
Our goal is to find values of alpha that can more accurately map RTT values to geographical distance.
Analysis Data Sources
Using PingER data
The PingER database includes RTT data measured from over 50 monitoring sites around the world to over 700 remote sites. For all of these sites PingER has values of their latitude and longitudes
Using the TULIP reflector
We have a large number of landmarks across the globe with known locations, so we can hopefully use these landmark locations to study alpha and estimate a reasonable characterization of alpha. The idea is that out of a large number of available landmarks, we can take one landmark (having known location) as a target and ping it from all other landmarks. This can be repeated by taking each of the other landmarks one at a time as the target and ping it from the other landmarks. As a result, we can get a table having exact distances and measured RTTs from each landmark to other landmarks.
We can use the TULIP reflector CGI script to make the above RTT measurements. The reflector will be using landmark's information from the sites.xml file. This is enabled by a script written by Fida.
Simple Frequency Histograms of Alpha
We made reflector measurements of RTT from landmarks around the world to target landmarks in Australia. From this we created a histogram of alpha frequencies for each of the target landmarks in Australia. An example is shown below for the Sydney Australia target landmark. 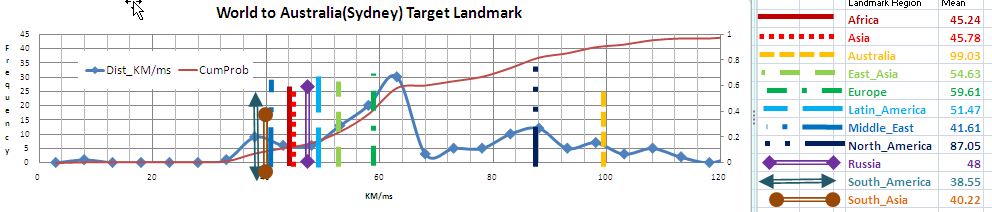
It is seen that the distribution is multi-modal. Many of the modes can be associated with landmarks from a regions having similar values of alpha for the measurement to Sydney. More data can be found in the spreadsheet. From this it is apparent that a single value of alpha is a poor approximation to the behavior of alpha. A spreadsheet of World to European targets is also available.
Correlations between RTT and Distance
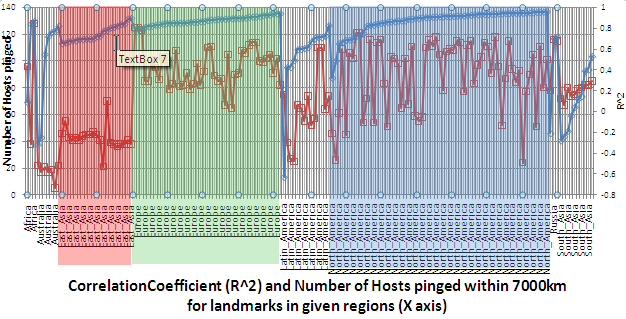
The spreadhseet for the 7000km data can be found here. For the 7000km maximum distance data, it is seen that low values of n often result in low values of R^2. Also for East-Asia, Europe and North America the correlations are usually strong (R^2 > 0.6).

The spreadsheet for the 1000km data can be found here.
Filtering Landmarks
If we are not interested in using delay to distance mapping for landmarks too far away from the target to be usable in the geolocation algorithm, we can neglect large values of RTT between landmarks and targets. But sometimes it's possible that our target is lying in such a geographical location where there are no active landmark nearby. In such a case probably some distantly located landmarks would be candidates for the final selection, so the threshold maximum RTT beyond which we do not use the landmarks measurement may depend on the landmark and target regions involved. If we want to avoid making such useless measurements then we need to identify the region of the target early on in the process.
Other metrics that can be useful for selecting tier1 landmarks are:
- The landmark should be reliable, i.e. up and responding correctly most of the time. Some help may be available by reviewing the reflector logs and the laundering of TULIP Landmarks.
- The landmark should be able to tell whether a target is in the same region or not (see Tier1 Landmark Selection).
- The landmark should have a strong correlation between RTT and distance for targets in its region.
- THe landmark should be able to ping the largest possible number of targets.