Looking at the average round trip times between monitor.niit.edu.pk and pinger.uettaxila.edu.pk there is a sudden step down drop on April 25th 2011 from ~30ms to ~ 5ms. The reverse step happens on May 7th 2011. There is also an outage between March 17th and April 15th.
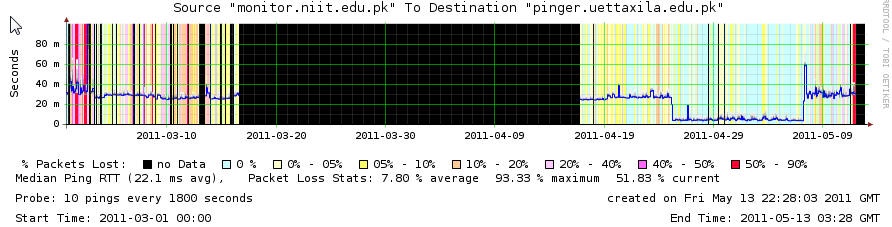
This is seen in both the SLAC and SEECS archive sites at http://www-wanmon.slac.stanford.edu/cgi-wrap/pingtable.pl?file=average_rtt&by=by-node&size=100&tick=last60days&from=PK.NIIT.EDU.N2&to=Pakistan&ex=none&only=all&dataset=hep&percentage=any and http://pinger.seecs.edu.pk/cgi-bin/pingtable.pl?file=average_rtt&by=by-node&size=100&tick=last60days&year=2011&month=05&from=PK.NIIT.EDU.N2&to=PK.UETTAXILA.EDU.N1&ex=none&dataset=hep&percentage=any
Looking at the raw data read from NIIT for UETAXILA it confirms RTT os ~ 5ms.
58cottrell@pinger:~>grep monitor /tmp/average_rtt-100-by-node-2011-05-01.txt \| grep uettax
monitor.niit.edu.pk pinger.uettaxila.edu.pk 3.590 4.021 4.021 4.226 5.036 6.491 7.223 6.147 6.389 7.042 7.042 5.601 5.601 6.365 6.365 6.588 4.592 4.951 5.030 7.237 6.474 5.321 4.780 4.739 monitor.niit.edu.pk pinger.uettaxila.edu.pk
pinger.uettaxila.edu.pk monitor.niit.edu.pk . 4.438 4.438 5.706 5.235 6.316 6.521 7.613 5.898 6.036 6.036 6.088 6.088 5.835 5.835 6.321 6.665 6.665 6.280 7.356 9.075 5.183 4.605 4.654 pinger.uettaxila.edu.pk monitor.niit.edu.pk
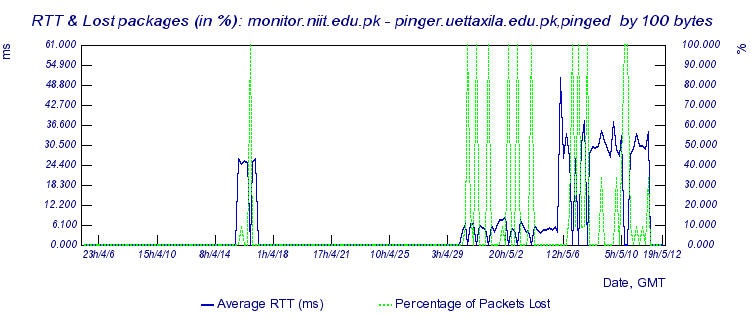
The drop in RTT is also confirmed looking at the FNAL graph:
Looking at the traceroutes from monitor.niit.edu.pk to uettaxila on one of the days of low Avg_RTT (here 5/1/2011) one gets the following message:
traceroute server busy at the moment. Please try again later. See The Naming System for information on host.domain and Addresses for information on Internet addresses.
To get a better view of the situation, we try to look at the reverse route i.e from pinger.uettaxila.edu.pk to monitor.niit.edu.pk. The smokeping graph thus obtained is: 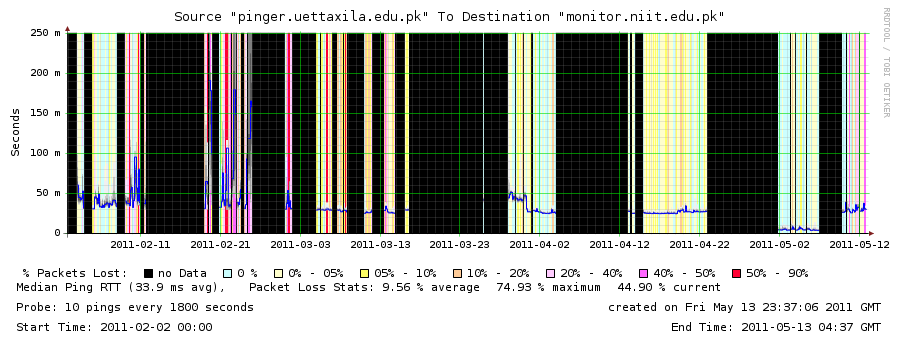
The smokeping graph shows that the node was showing a fluctuating UP/DOWN behavior during the last three months. However, the drop in Avg_RTT is observed here also (see at 2011-05-02).
Looking at the traceroutes from pinger.uettaxila.edu.pk to monitor.niit.edu.pk on one of the days of low Avg_RTT (here 5/1/2011) following output is observed:
Executing exec(traceroute, -m 30 -q 3 -f 3, 115.186.131.81, 140)
traceroute to 115.186.131.81 (115.186.131.81), 30 hops max, 140 byte packets
 3  rwp44.pie.net.pk (221.120.253.121)  5.457 ms  5.444 ms  5.435 ms
 4  rwp44.pie.net.pk (221.120.254.62)  6.247 ms  7.673 ms  7.667 ms
 5  rwp44.pie.net.pk (221.120.253.10)  4.555 ms  4.556 ms  4.547 ms
 6  rwp44.pie.net.pk (221.120.237.102)  4.538 ms  4.534 ms  4.529 ms
 7  58-65-175-206.nayatel.pk (58.65.175.206)  4.506 ms  4.500 ms  4.726 ms
 8  * 115-186-128-178.nayatel.pk (115.186.128.178)  6.589 ms  6.587 ms
 9  115-186-131-81.nayatel.pk (115.186.131.81)  6.429 ms  4.927 ms  4.914 ms
However today (5-13-2011) the traceroute output is given as:
Executing exec(traceroute, -m 30 -q 3 -f 3, 115.186.131.81, 140)
traceroute to 115.186.131.81 (115.186.131.81), 30 hops max, 140 byte packets
 3  rwp44.pie.net.pk (221.120.253.121)  4.624 ms  4.601 ms  4.590 ms
 4  rwp44.pie.net.pk (221.120.254.62)  4.566 ms  4.570 ms  5.414 ms
 5  rwp44.pie.net.pk (221.120.253.10)  4.267 ms  4.270 ms  4.273 ms
 6  rwp44.pie.net.pk (221.120.237.102)  4.265 ms  4.258 ms  4.773 ms
 7  58-65-175-206.nayatel.pk (58.65.175.206)  26.374 ms  26.374 ms  26.367 ms
 8  * * *
 9  * * *
10  * * *
11  * * *
12  * * *
13  * * *
14  * * *
15  * * *
16  * * *
17  * * *
18  * * *
19  * * *
20  * * *
21  * * *
22  * * *
23  * * *
24  * * *
25  * * *
26  * * *
27  * * *
28  * * *
29  * 115-186-131-81.nayatel.pk (115.186.131.81)  25.631 ms  25.617 ms
This time hop 7 is taking much longer time than the last results.
Looking at the pingtable.pl data , following are the metric measurements from all the nodes in Pakistan who are monitoring uettaxila.
|
Jan 18th to March 2nd |
March 3rd to May 15 |
Average RTT (ms) |
63.01 |
29.68 |
Ping Unreachability (%age) |
88.66 |
74.51 |
Packet Loss (%age) |
7.57 |
3.58 |
TCP Throughput (bps) |
1.82E+03 |
9.32E+03 |
IPDV (ms) |
61.26 |
18.83 |
MOS |
3.62 |
4.10 |
This is a significant improvement in terms of average RTT, packet loss, throughput and IPDV . However improvement in Ping Unreachability is lesser than expected.
PERN PoP Islamabad to UETTAXILA
Considering that monitor.niit.edu.pk is not a pern node, we tried to analyze the performance of UET Taxila from Pern PoP Islamabad node.
Looking at the pingtable.pl following trend was observed for various metrics.
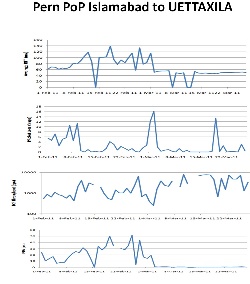
High RTT values were observed previously with frequent fluctuations however, RTT values lowered and smoothed out later on. This fact is also supported by the IPDV values before and after the network change as you can see in the graph above. An increment in Throughput values is also evident with the reduction in Packet Loss. All these are results of increased capacity of the network.
This can also be shown in numeric figures by looking at the following table obtained by averaging the pingtable.pl values. The Average RTT reduced by a factor of 1.91, packet loss by a factor of 3, throughput increased 3.14 times and IPDV reduced by a factor of 38.
Metrics |
1st Feb-2nd Mar |
3rd Mar-27th Mar |
|---|---|---|
Average RTT (ms) |
84.62 |
44.38 |
Packet Loss (%age) |
3.68 |
1.23 |
TCP Throughput (Mbps) |
1.4 |
4.4 |
IPDV (ms) |
23.94 |
0.63 |
Find spreadsheet here.
Due to some unavoidable reasons, no smokeping graphs could be generated so far. Once we resolve the issue, we'll show smokeping graphs and traceroutes to support the improvement in network performance.
Traceroute were taken from PERN POP Islamabad to Uettaxila showing the RTT at each hop.
Executing exec(traceroute, -m 30 -q 3 -f 3, 121.52.150.164, 140)
traceroute to 121.52.150.164 (121.52.150.164), 30 hops max, 140 byte packets
 4  rwp44.pie.net.pk (221.120.254.5)  44.905 ms rwp44.pie.net.pk (221.120.251.29)  24.137 ms rwp44.pie.net.pk (221.120.254.5)  44.803 ms
 5  rwp44.pie.net.pk (221.120.254.61)  45.150 ms  45.167 ms rwp44.pie.net.pk (221.120.254.13)  46.383 ms
 6  rwp44.pie.net.pk (221.120.253.122)  45.073 ms  45.118 ms  45.168 ms
 7  uettaxila.pie.net.pk (221.120.235.126)  58.911 ms  58.896 ms  58.880 ms
 8   (121.52.150.164)  46.431 ms !X  46.175 ms !X  46.519 ms !X
It is observed that the route goes through the 3 interfaces named rwp44.pie.net.pk. Delay to reach rwp44.pie.net.pk is much longer which results in increased RTT for uettaxila. However, from there it takes only 13.8 ms to reach uettaxila.
Suggestions from improvement:
Increased Link Capacity:
Reduced average RTT is a consequence of increased link capacity.
Unresolved Issue:
- Since Friday 5/13/11, I am unable to load SEECS pingtable and the smokeping graphs from SEECS pingtable. I need them for analysis. Can someone get this resolved so that I can make report as soon as possible.