Issue
List of commands for this test
Code for time monitoring
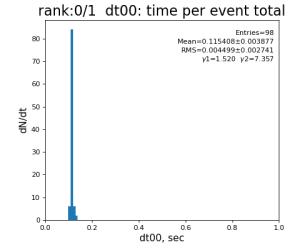
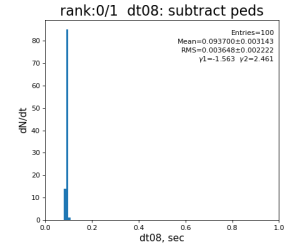
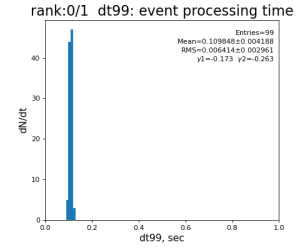
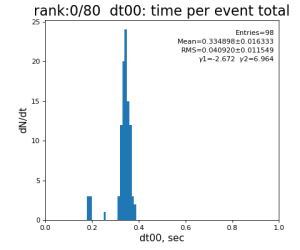
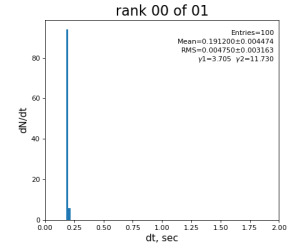
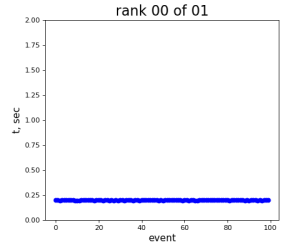
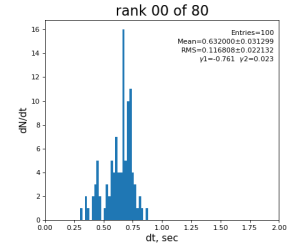
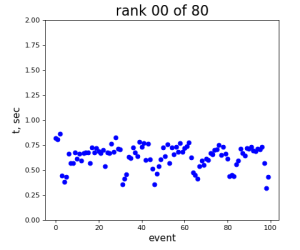
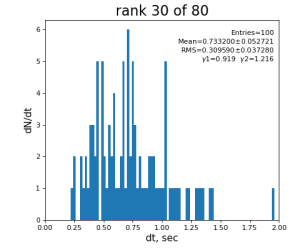
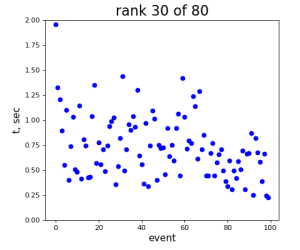
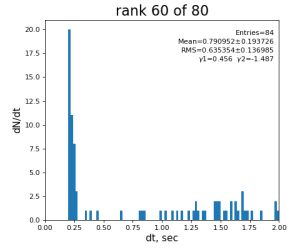
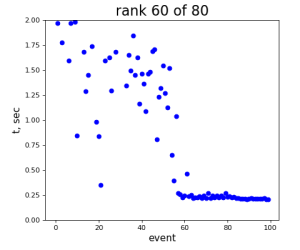
Timing histograms
Single core processing
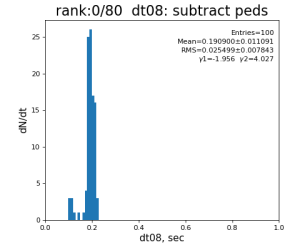
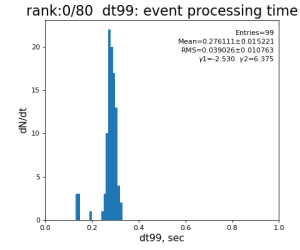
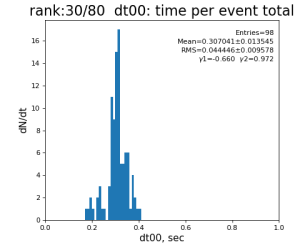
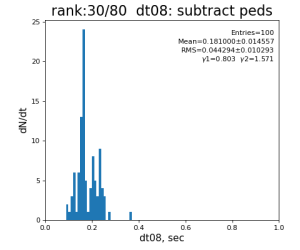
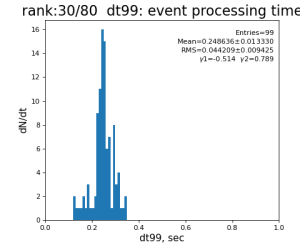
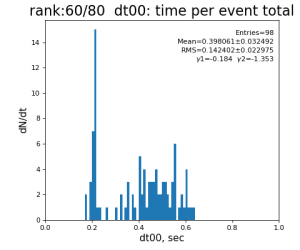
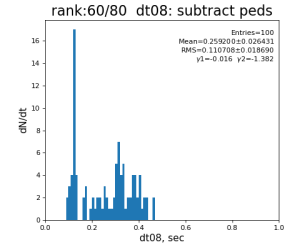
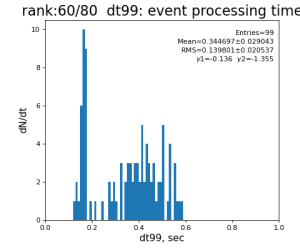
80-core processing for ranks 0, 30, and 60
Results
Table shows mean time increment and their statistical uncertainty from associated histograms.
| t point | time increment | point description | time for rank 0/1 | rank 0/80 | rank 30/80 | rank 60/80 |
|---|---|---|---|---|---|---|
| 1 | t1 - t0 | det.raw | 0.8±0.2 ms | 4.0 ±0.6 ms | 3.2±0.4 ms | 3.5 ±0.8 ms |
| 2 | t2 - t1 | det.pedestals | 15±3 μs | 36 ±10 μs | 31±6 μs | 39 ±17 μs |
| 3 | t3 - t2 | det.gain,offset | 15±2 μs | 27 ±4 μs | 26±4 μs | 27 ±6 μs |
| 4 | ... | cmpars | 25±1 μs | 50 ±7 μs | 58±26 μs | 71 ±33 μs |
| 5 | gfac | 2±0 μs | 6 ±1 μs | 7±1 μs | 7 ±2 μs | |
| 6 | gr0,1,2 | 1.3±0.2 ms | 10.5 ±1.1 ms | 7.0±0.9 ms | 9.7 ±1.6 ms | |
| 7 | make arrf | 1.76±0.05 ms | 9.2 ±0.9 ms | 6.3±0.7 ms | 9.0 ±1.5 ms | |
| 8 | subtract peds | 93.7±3.1 ms | 191 ±11 ms | 181±15 ms | 259 ±26 ms | |
| 9 | eval gain factor for gain ranges | 4.9±0.6 ms | 20.3 ±1.5 ms | 14.6±1.2 ms | 17.3 ±2.0 ms | |
| 10 | eval offset for gain ranges | 6.2±0.4 ms | 18.5 ±1.3 ms | 18.4±1.4 ms | 19.2 ±2.1 ms | |
| 11 | subtract offset | 1.0±0.2 ms | 6.0 ±0.7 ms | 5.3±0.6 ms | 6.2 ±1.2 ms | |
| 12 | get mask | 3±2 μs | 6 ±2 μs | 6±2 μs | 7 ±2 μs | |
| 13 | common mode turned off | 7±1 μs | 15 ±2 μs | 17±2 μs | 20 ±3 μs | |
| 14 | t14 - t13 | apply gain factor and mask | 4.0±0.7 ms | 14.9 ±2.0 ms | 13.9±1.6 ms | 19.2 ±3.5 ms |
| 99 | t14 - t0 | per evt time, inside det.calib | 109.8±4.2 ms | 276 ±15 ms | 247±13 ms | 345 ±29 ms |
| 0 | t0 - t0 previous evt | time between consecutive det.calib | 115.4±3.9 ms | 335 ±16 ms | 307±14 ms | 398 ±32 ms |
Summary
- single core processing is faster than per/core time in 80–core case, factor 2.5-3 FOR ALL OPERATIONS
- in 80-core case: time per core is consistent between cores
- all constants are cashed and access to constants is fast at sub-milisecond level
- common mode correction is turned off, as well as mask?
- most time consuming operation is indexed pedestal subtraction
indexed by gain ranges pedestal subtraction
    t07 = time()

    arrf[gr0] -= peds[0,gr0]
    arrf[gr1] -= peds[1,gr1]
    arrf[gr2] -= peds[2,gr2]

    t08 = time()
- bad single-to-multicore scaling issue has nothing to do with particular algorithm, it is common problem for any algorithm
2024-01-16 Test for simulated events
Time consuming code
2024-01-16 Test Summary
- runing on sdfmilan031 - shows minor ~ 5% the mean time difference between 1-core and 80-core processing is larger
2024-01-17 Test for simulated events with minor modifications
Test variation
- array shape is changed from (1024, 1024) → (8*512, 1024) 4M
- array generation is excluded from time measurement, only indexed subtraction contributes to time measurement
- do not pre-create random arrays, it is generated in each core... requires too much memory for all cores.
- run on sdfmilan047: ana-4.0.58-py3 [dubrovin@sdfmilan047:~/LCLS/con-py3]$ mpirun -n 80 python test-mpi-numpy-hist.py
Time consuming code
Results
Single core processing
80-core processing for ranks 0, 30, and 60
2024-01-17 Test Summary
- if random array generation is excluded from time measurement, the mean time difference between 1-core and 80-core processing is larger
- the main contribution to time difference comes from reserved host...
- sdfmilan047 - looks like extremely "time-noisy" in multi-core processing...
- sdfmilan031 - in previous test looks pretty "calm"
2024-01-19 Test for a few hosts
- The same simulation algorithm as before is used to compare processing time of different cores.
- To get rid of obvious fluctuation off time measurement between cores, a sample of cores is extended from three, 0,30,60 to seven 0,10,20,30,40,50,60 of 80.
- Mean processing time and its uncertainty in milliseconds for single core (core 0/1) and a few cores of 80 are shown in table.
- Ratio represents the ratio of 80-core average over core 0/1.
| host name | core 0/1 | 0/80 | 10/80 | 20/80 | 30/80 | 40/80 | 50/80 | 60/80 | 70/80 | 80-core average | Ratio | Largest ratio |
|---|---|---|---|---|---|---|---|---|---|---|---|---|
| sdfmilan027 | 192 ±6 | 241 ±19 | 430 ±32 | 336 ±24 | 287 ±16 | 245 ±17 | 412 ±30 | 342 ±24 | 327.6 | 1.71 | 2.24 | |
| sdfmilan049 | 210 ±1 | 280 ±19 | 369 ±28 | 245 ±45 | 282 ±17 | 290 ±24 | 367 ±28 | 242 ±37 | 296.4 | 1.41 | 1.75 | |
| sdfmilan056 | 191 ±3 | 328 ±21 | 269 ±40 | 258 ±32 | 347 ±28 | 324 ±22 | 254 ±34 | 346 ±30 | 303.7 | 1.59 | 1.82 | |
| sdfmilan057 | 190 ±4 | 262 ±20 | 292 ±21 | 439 ±26 | 226 ±12 | 256 ±19 | 297 ±20 | 467 ±36 | 319.9 | 1.68 | 2.46 | |
| sdfmilan065 | 203 ±7 | 281 ±15 | 345 ±23 | 245 ±22 | 248 ±20 | 276 ±15 | 353 ±24 | 250 ±22 | 285.4 | 1.41 | 1.74 | |
| sdfmilan105 | 190 ±2 | 261 ±36 | 277 ±20 | 282 ±15 | 276 ±14 | 263 ±48 | 273 ±19 | 284 ±26 | 273.7 | 1.44 | 1.49 | |
| sdfmilan130 | 190 ±3 | 394 ±26 | 270 ±23 | 323 ±20 | 230 ±10 | 379 ±27 | 276 ±24 | 322 ±20 | 313.4 | 1.65 | 2.07 | |
| sdfmilan202 | 210 ±0 | 346 ±32 | 351 ±28 | 281 ±16 | 286 ±16 | 355 ±34 | 345 ±28 | 297 ±16 | 323.0 | 1.54 | 1.69 | |
| sdfmilan203 | 191 ±4 | 281 ±26 | 355 ±31 | 288 ±26 | 332 ±44 | 271 ±32 | 347 ±26 | 282 ±21 | 308.0 | 1.61 | 1.86 | |
| sdfmilan225 | 204 ±7 | 409 ±29 | 296 ±23 | 230 ±10 | 230 ±10 | 398 ±26 | 289 ±24 | 232 ±9 | 297.7 | 1.46 | 2.00 | |
sdfmilan213 cpu_num | 293 6 0 | 339 ±18 13 | 355 ±22 45 | 605 ±104 74 | 388 ±27 103 | 337 ±18 5 | 361 ±21 44 | 613 ±95 72 | 422 ±27 106 | 427.5 | 1.46 | 2.09 |
sdfmilan047 cpu_num | 210 1 0 | 639 ±34 8 | 483 ±219 32 | 474 ±284 65 | 744 ±75 104 | 637 ±43 40 | 588 ±266 36 | 443 ±202 67 | 722 ±75 | 590.8 | 2.81 | 3.54 |
2024-01-19 Time difference vs array size
- shape is decreased in size from (8*512,1024) to (2*512,1024) 1M
| host name | core 0/1 | 0/80 | 10/80 | 20/80 | 30/80 | 40/80 | 50/80 | 60/80 | 70/80 | 80-core average | Ratio | Largest ratio |
|---|---|---|---|---|---|---|---|---|---|---|---|---|
| sdfmilan039 | 47.6 ±0.7 | 56.0 ±2.5 | 59.2 ±4.7 | 59.9 ±6.3 | 52.8 ±3.4 | 56.3 ±2.4 | 58.6 ±5.0 | 51.2 ±9.9 | 51.3 ±3.3 | 55.7 | 1.17 | 1.26 |
| sdfmilan225 | 47.6 ±0.5 | 56.6 ±3.2 | 55.4 ±4.2 | 52.8 ±2.4 | 52.3 ±2.3 | 55.8 ±3.8 | 55.3 ±3.5 | 52.5 ±2.5 | 52.0 ±2.4 | 54.1 | 1.14 | 1.19 |
- shape is increased in size from (32*512,1024) 16M
| host name | core 0/1 | 0/80 | 10/80 | 20/80 | 30/80 | 40/80 | 50/80 | 60/80 | 70/80 | 80-core average | Ratio | Largest ratio |
|---|---|---|---|---|---|---|---|---|---|---|---|---|
| sdfmilan225 | 766 ±20 | 1251 ±91 | 1099 ±108 | 958 ±174 | 955 ±199 | 1206 ±83 | 1086 ±106 | 949 ±181 | 952 ±231 | 1057 | 1.38 | 1.63 |
| sdfmilan031 | 760 ±1 | 1141 ±81 | 1144 ±94 | 910 ±111 | 947 ±118 | 1221 ±74 | 1157 ±93 | 947 ±108 | 937 ±104 | 1051 | 1.38 | 1.61 |
References
Overview
Content Tools