Search/Navigation:
Related:
SLAC![]() /EPP
/EPP![]() /HPS Public
/HPS Public![]()
Jefferson Lab![]() /Hall B
/Hall B![]() /HPS Run Wiki
/HPS Run Wiki![]()
S30XL-LESA/LDMX
The HPS Monitoring Application is a Java Swing GUI application which provides an online data monitoring framework for the experiment.
The application is part of the HPS Java project, so the Installing HPS Java instructions should be followed to build it.
You may also find an hps-distribution jar using a Nexus repository search and download it through the web interface.
The application is activated through its main method and takes only one command line argument, which is the name of a settings properties file.
java -jar hps-distribution-bin.jar org.hps.monitoring.application.Main -c settings.prop
The settings files are not typically hand edited but created by saving settings from the GUI's menu.
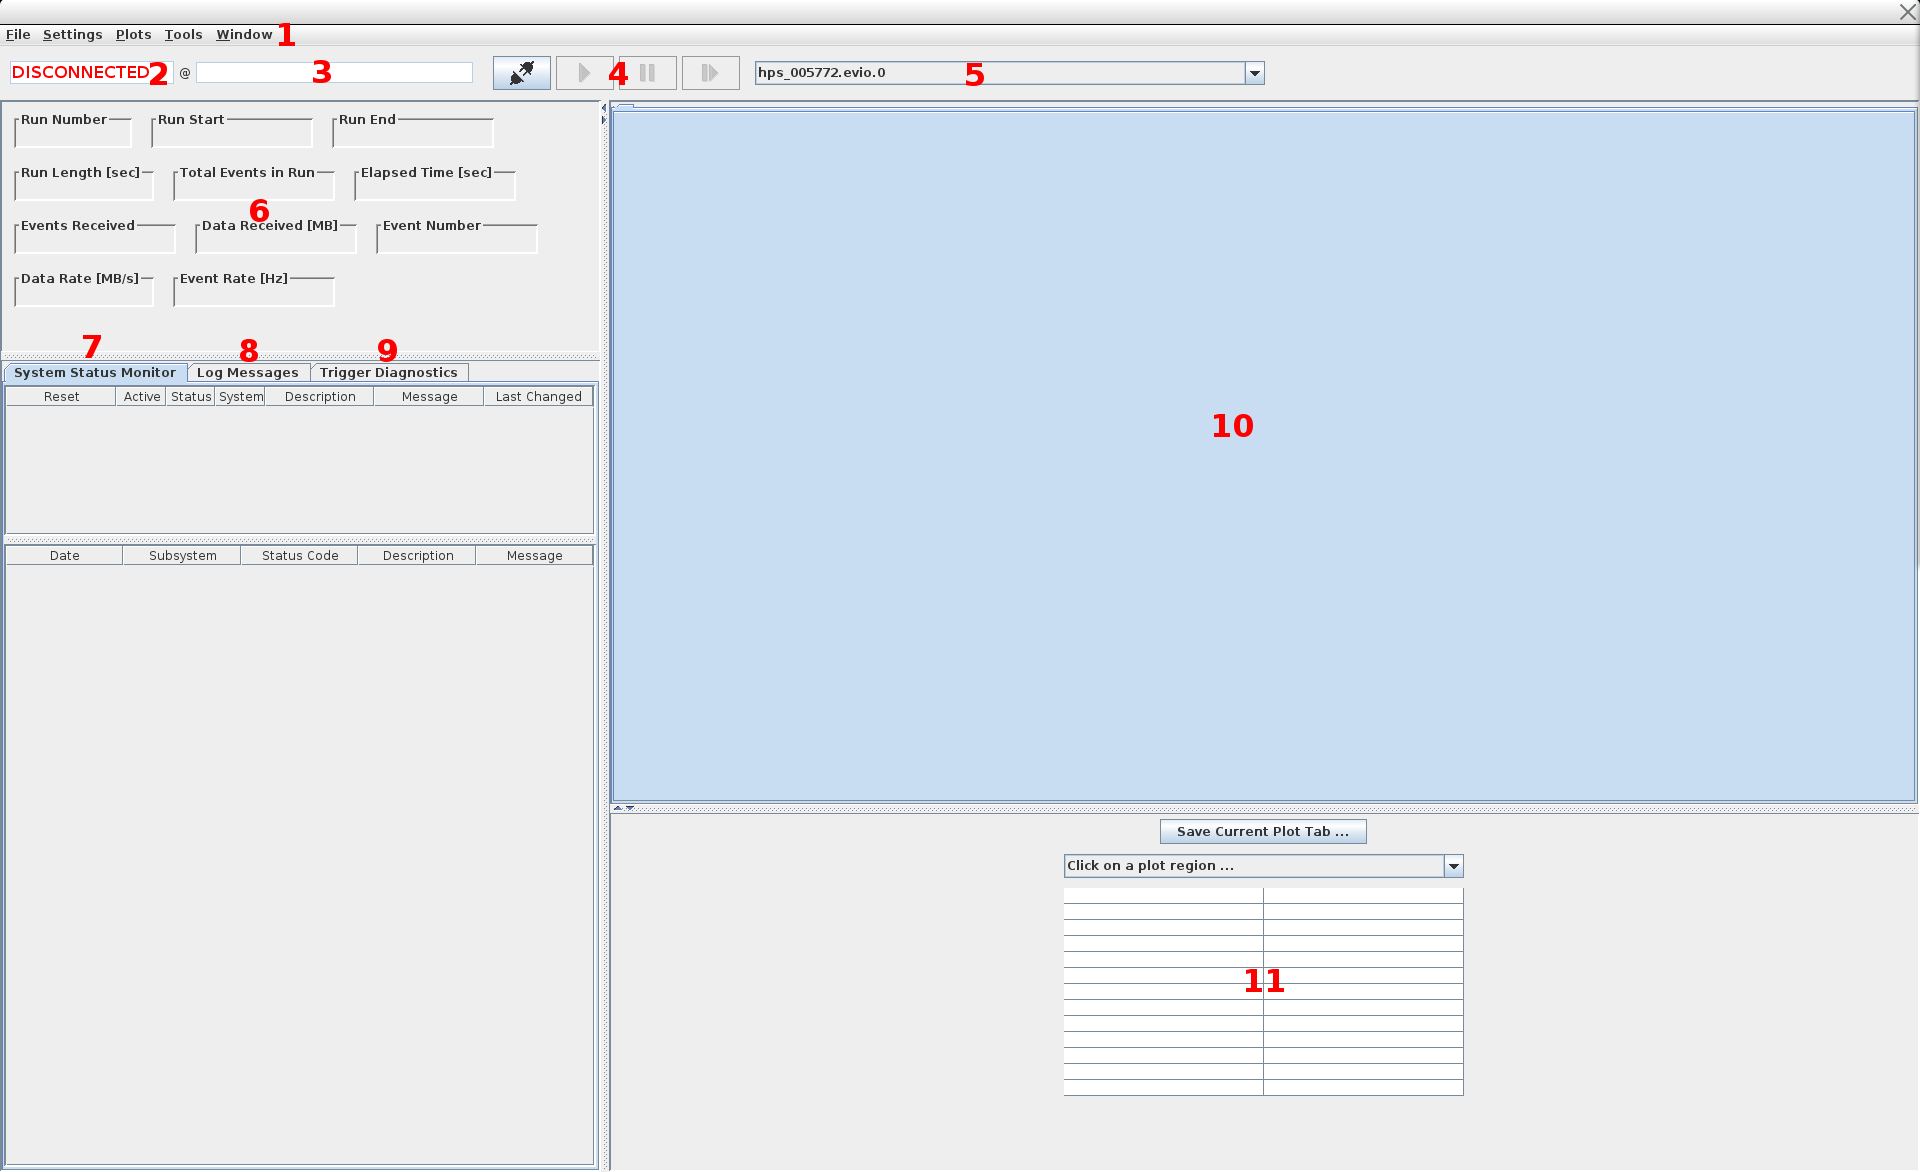
| Label | Name | Description |
|---|---|---|
| 1 | Application Menu Bar | contains menus with commands |
| 2 | Status Panel | application's current status (connected or disconnected) |
| 3 | Date Panel | shows when status last changed |
| 4 | Control Buttons | used to connect, disconnect, pause, continue, etc. |
| 5 | Data Source | available data sources (files or ET) |
| 6 | Event Dashboard | statistics for the current session |
| 7 | System Status Monitor Tab | system status monitoring tables (for alarms) |
| 8 | Log Tab | list of application log messages |
| 9 | Trigger Diagnostics | shows trigger diagnostics info when the right Driver is active in the job |
| 10 | Plot Panel | shows the current set of plots in the session |
| 11 | Plot Info Panel | shows information about the currently selected plot |
Settings can be saved under Save Settings in the Settings menu.
Previously saved settings may also be loaded in the application under Load Settings in the Settings menu. You should give these files the extension of .prop to indicate that they are Java properties files. The settings will not take effect until a new session is started. If there is a currently active session, it will not be affected.
Configuring Settings
Settings can be configured in the GUI by clicking on Open Settings Window under the Settings menu.
The first tab contains settings for configuring the application's connection to an ET server.
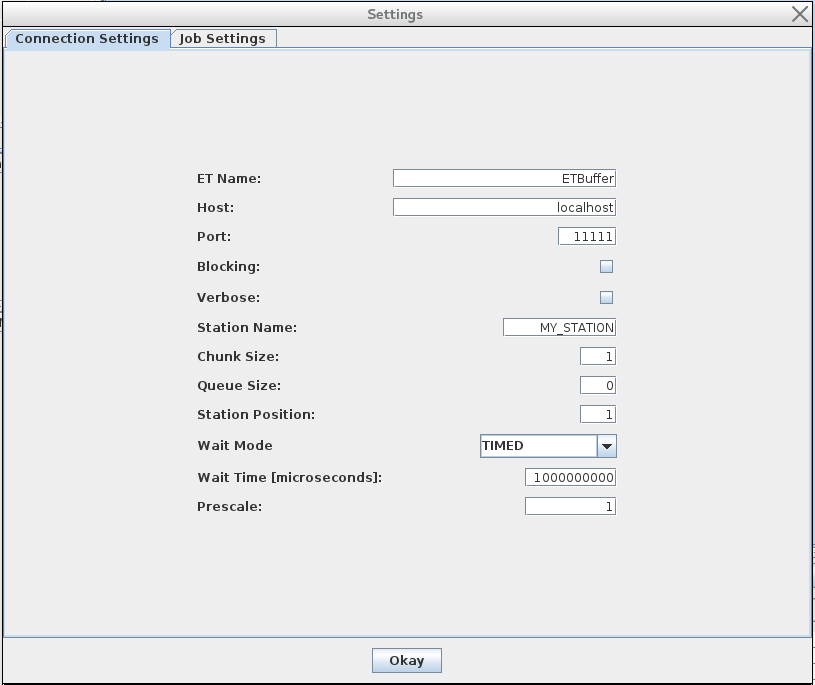
| Setting | Description | Notes |
|---|---|---|
| ET Name | name of the ET buffer file | |
| Host | ET server's TCP/IP hostname | |
| Port | port for connection to server | |
| Blocking | block when reading from ET system | usually should be deselected |
| Verbose | run ET station in verbose mode | |
| Station Name | the name of the ET station used by the monitoring application | should not exist already |
| Chunk Size | ||
| Queue Size | ||
| Station Position | ||
| Wait Mode | ||
| Wait Time |