In March and April 2007 we worked with people from Palestine and the University at Buffalo to install PingER Measurement Points (MPs) in Al Quds University in Ramallah and the Islamic University of Gaza. They were both connected to the Mediterranean fibre optic cable. There is a probability they will lose their connection to the Mediterranean fibre optic cable in Summer 2007.
Al Quds successfully installed PingER without help. It has been measuring and reporting since March 23, 2007. It has been very reliable with few losses of data.
Warren Matthews of Georgia Tech had to step in and assist IUGaza in getting PingER2 running. There were problems with the cronjob and possibly ntpd. IUGaza has been monitoring successfully since April 7th, 2007. They did not monitor data all day on April 22. There have been problems on 2 days gathering the data where I have either contacted the IUGaza site contact (Apr 28th to fix the web server) or had to re-run the gathering script. It was having problems again on May 3-7, 2007 and has been reported to the contact.
On April 3rd the Al-Quds Open University said they would prepare a new machine and install software. I responded on April 4th and April 17th, but have heard nothing since. I prompted them again 5/4/07.
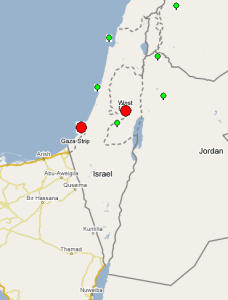
The locations of the sites are shown below.

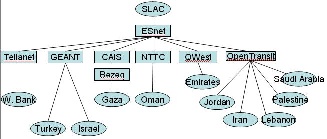
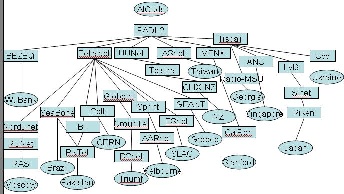
The main Autonomous System Domains (ASN) in the routes from SLAC to the Middle East countries for the sites we monitor are shown in the figure to the left below. It can be seen that many providers are used. The Palestinian sites (Gaza and the West Bank) use different providers from each other and from the neighboring countries. The figure on the right shows the ASNs used to route from Al Quds to various countries of the world.
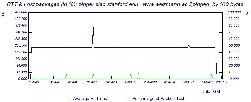
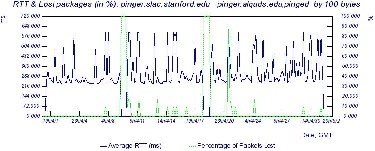
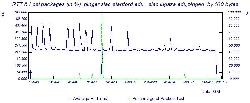
The hourly losses and RTTs seen from SLAC for Israel, Al Quds and IUGaza are shown below. It is seen that israel has almost no variability so the link is un-congested. Both the Al Quds and IUGaza time series show strong diurnal changes indication congestion/queuing during work hours. Comparing Al Quds and IUGaza it appears they have similar minimum RTTs of about 250ms. IUGaza has improved with less congestion since April 17, 2007. Al Quds had two periods of unreachability (100% loss on the green line).
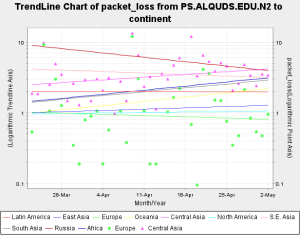
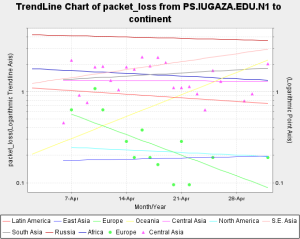
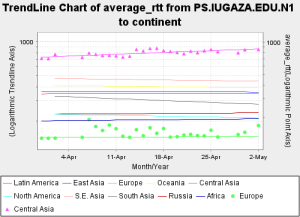
The monthly average Round Trip Times (RTTs) from Al Quds and IUGaza are shown below. The individual data points daily avergae(average_RTT) are shown to show the variability.

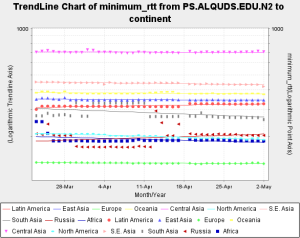
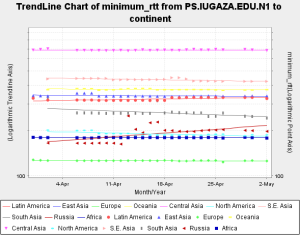
The minimum RTTs are shown below with the individual points (since minimum RTTs are more stable).
The packets losses are shown below:
